The shape of British running
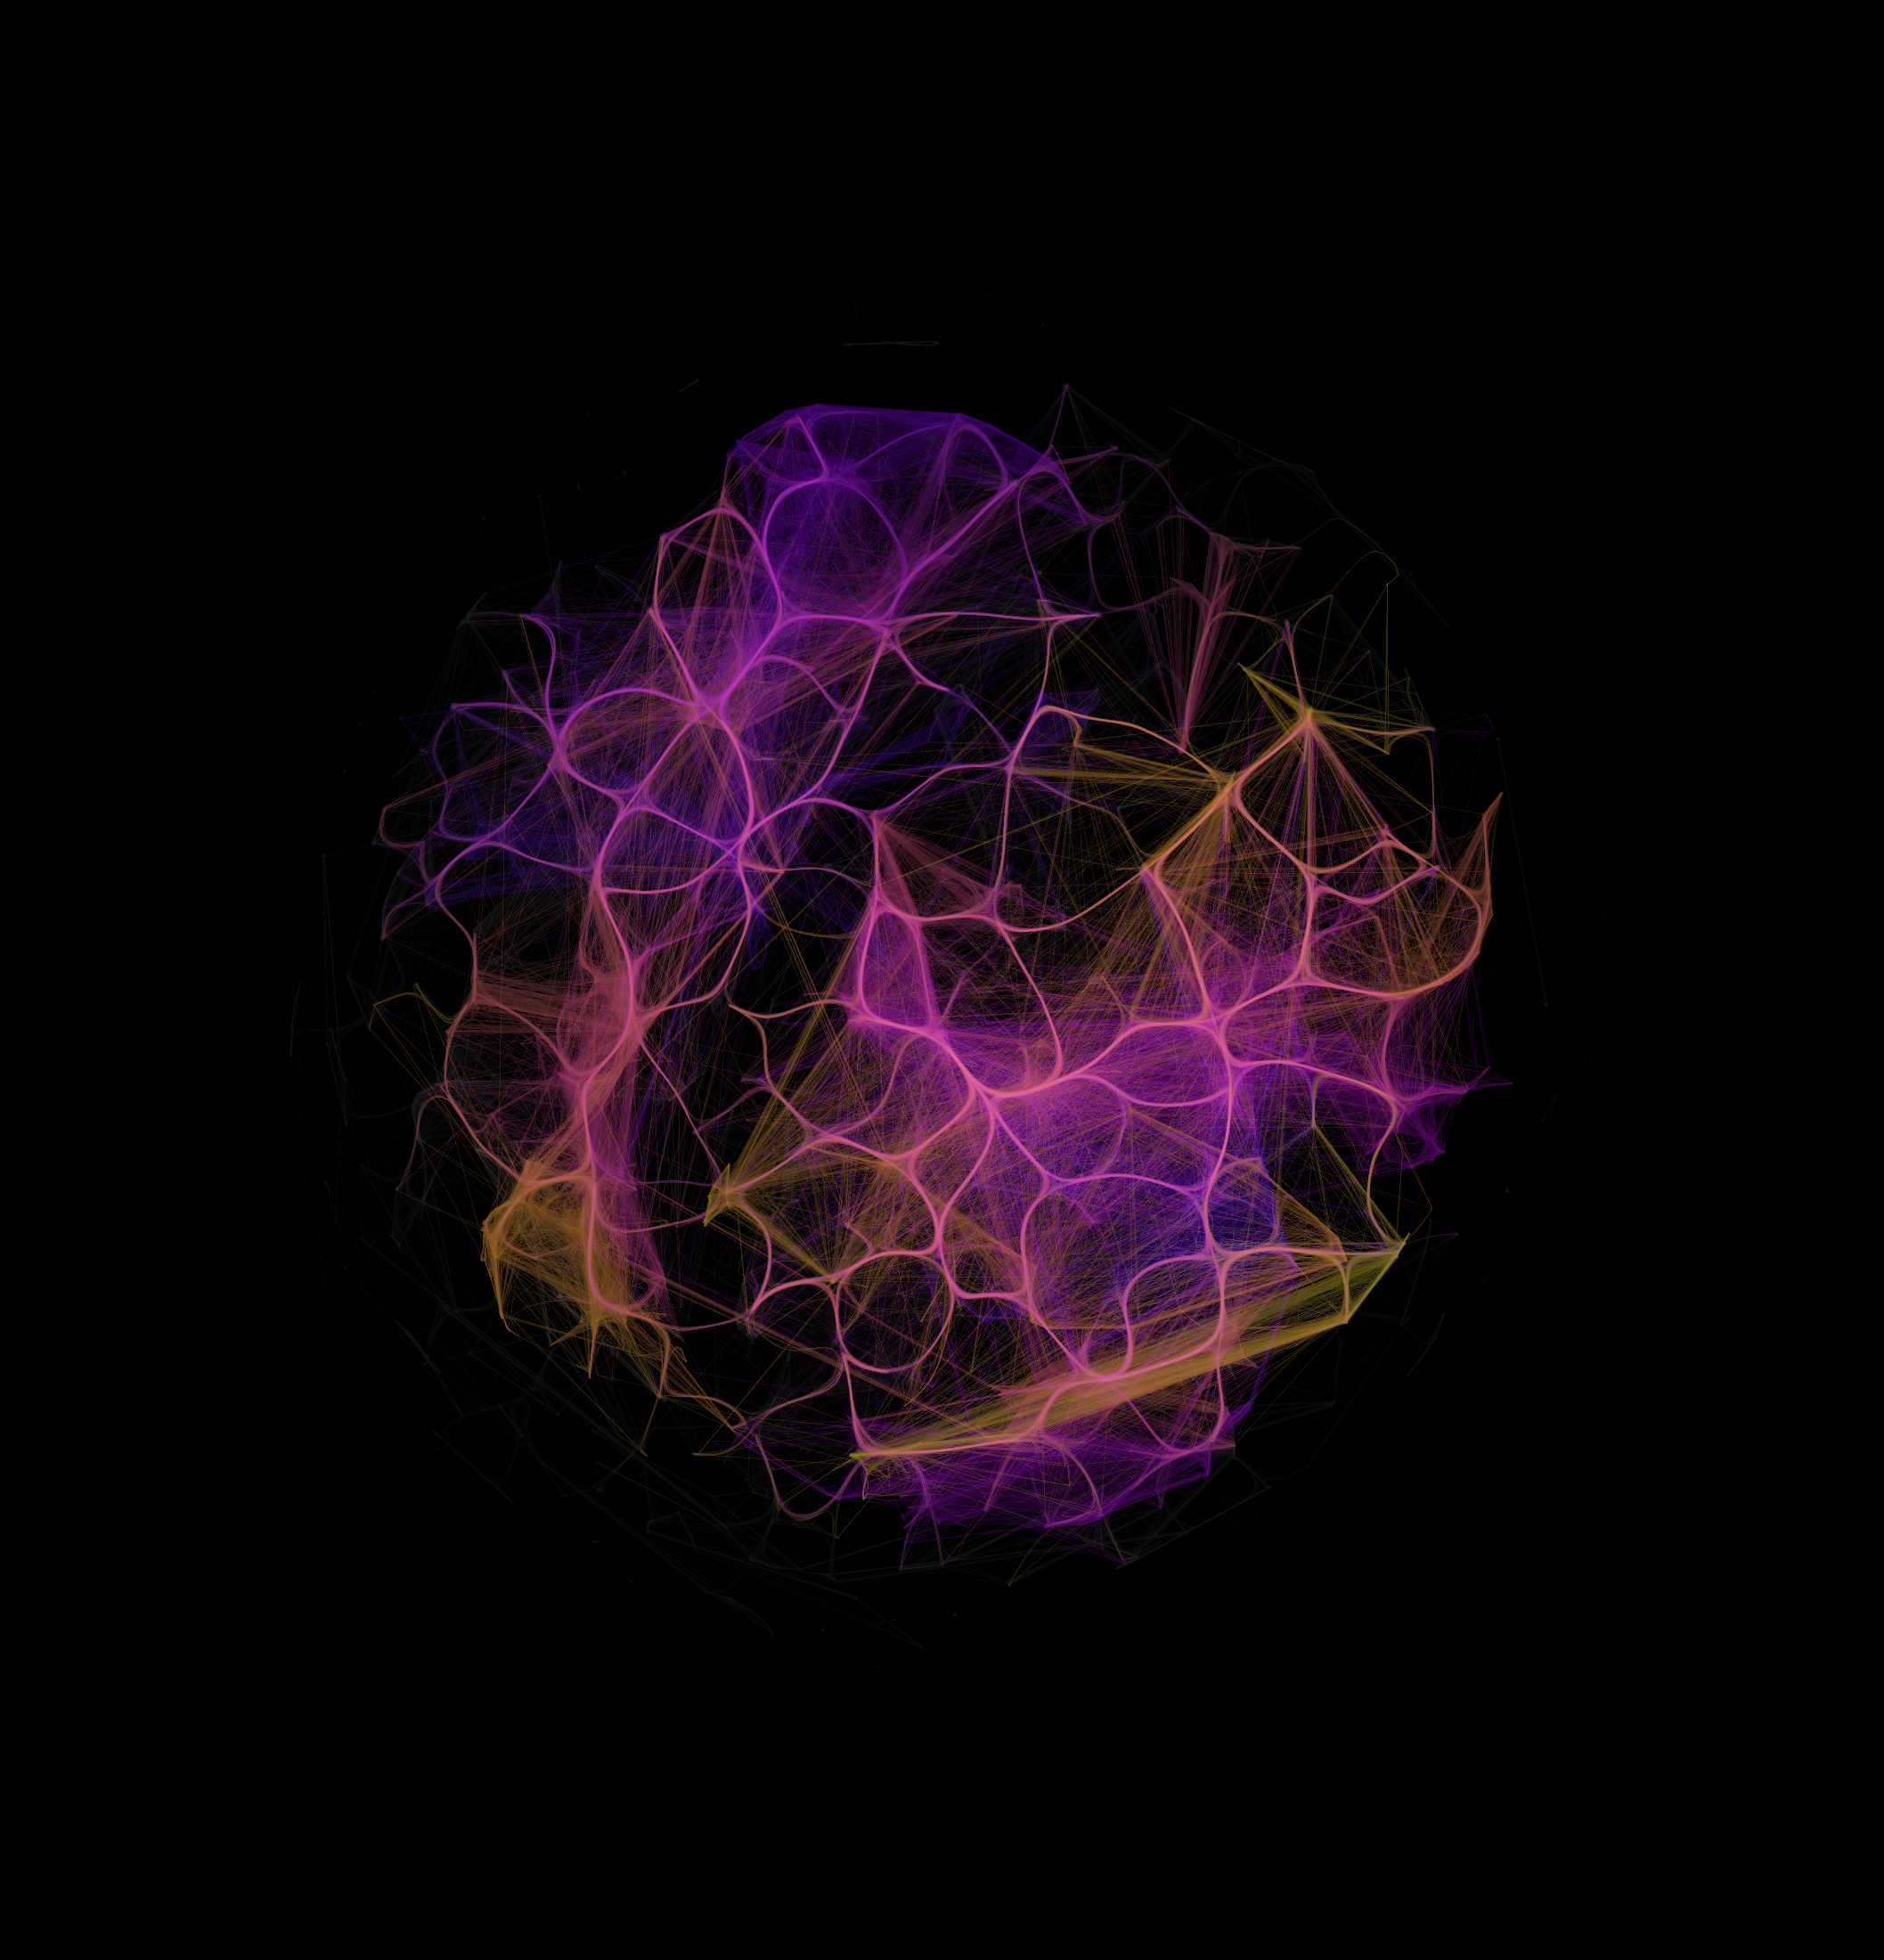
Draw a line between any two runners who lined up in the same race, across 850,000 results from 56 leagues and championships, and a structure appears: dense knots of clubs joined by bright bridges. Colour it by the network's own communities and the knots turn out to be regions: Surrey, South Wales, the North-West.
3 July 2026 · 4 min read
TL;DR
Take 850,699 race results: 56 cross-country leagues, county and national championships, and track meetings, everything the archive held when this network was drawn. (It keeps growing, and has since passed 1.3 million results from 64 sources.) Make every athlete a point, and join two athletes whenever they ran in the same race, weighting the line by how often they have met. Then run a force-directed layout and see what shape it takes.
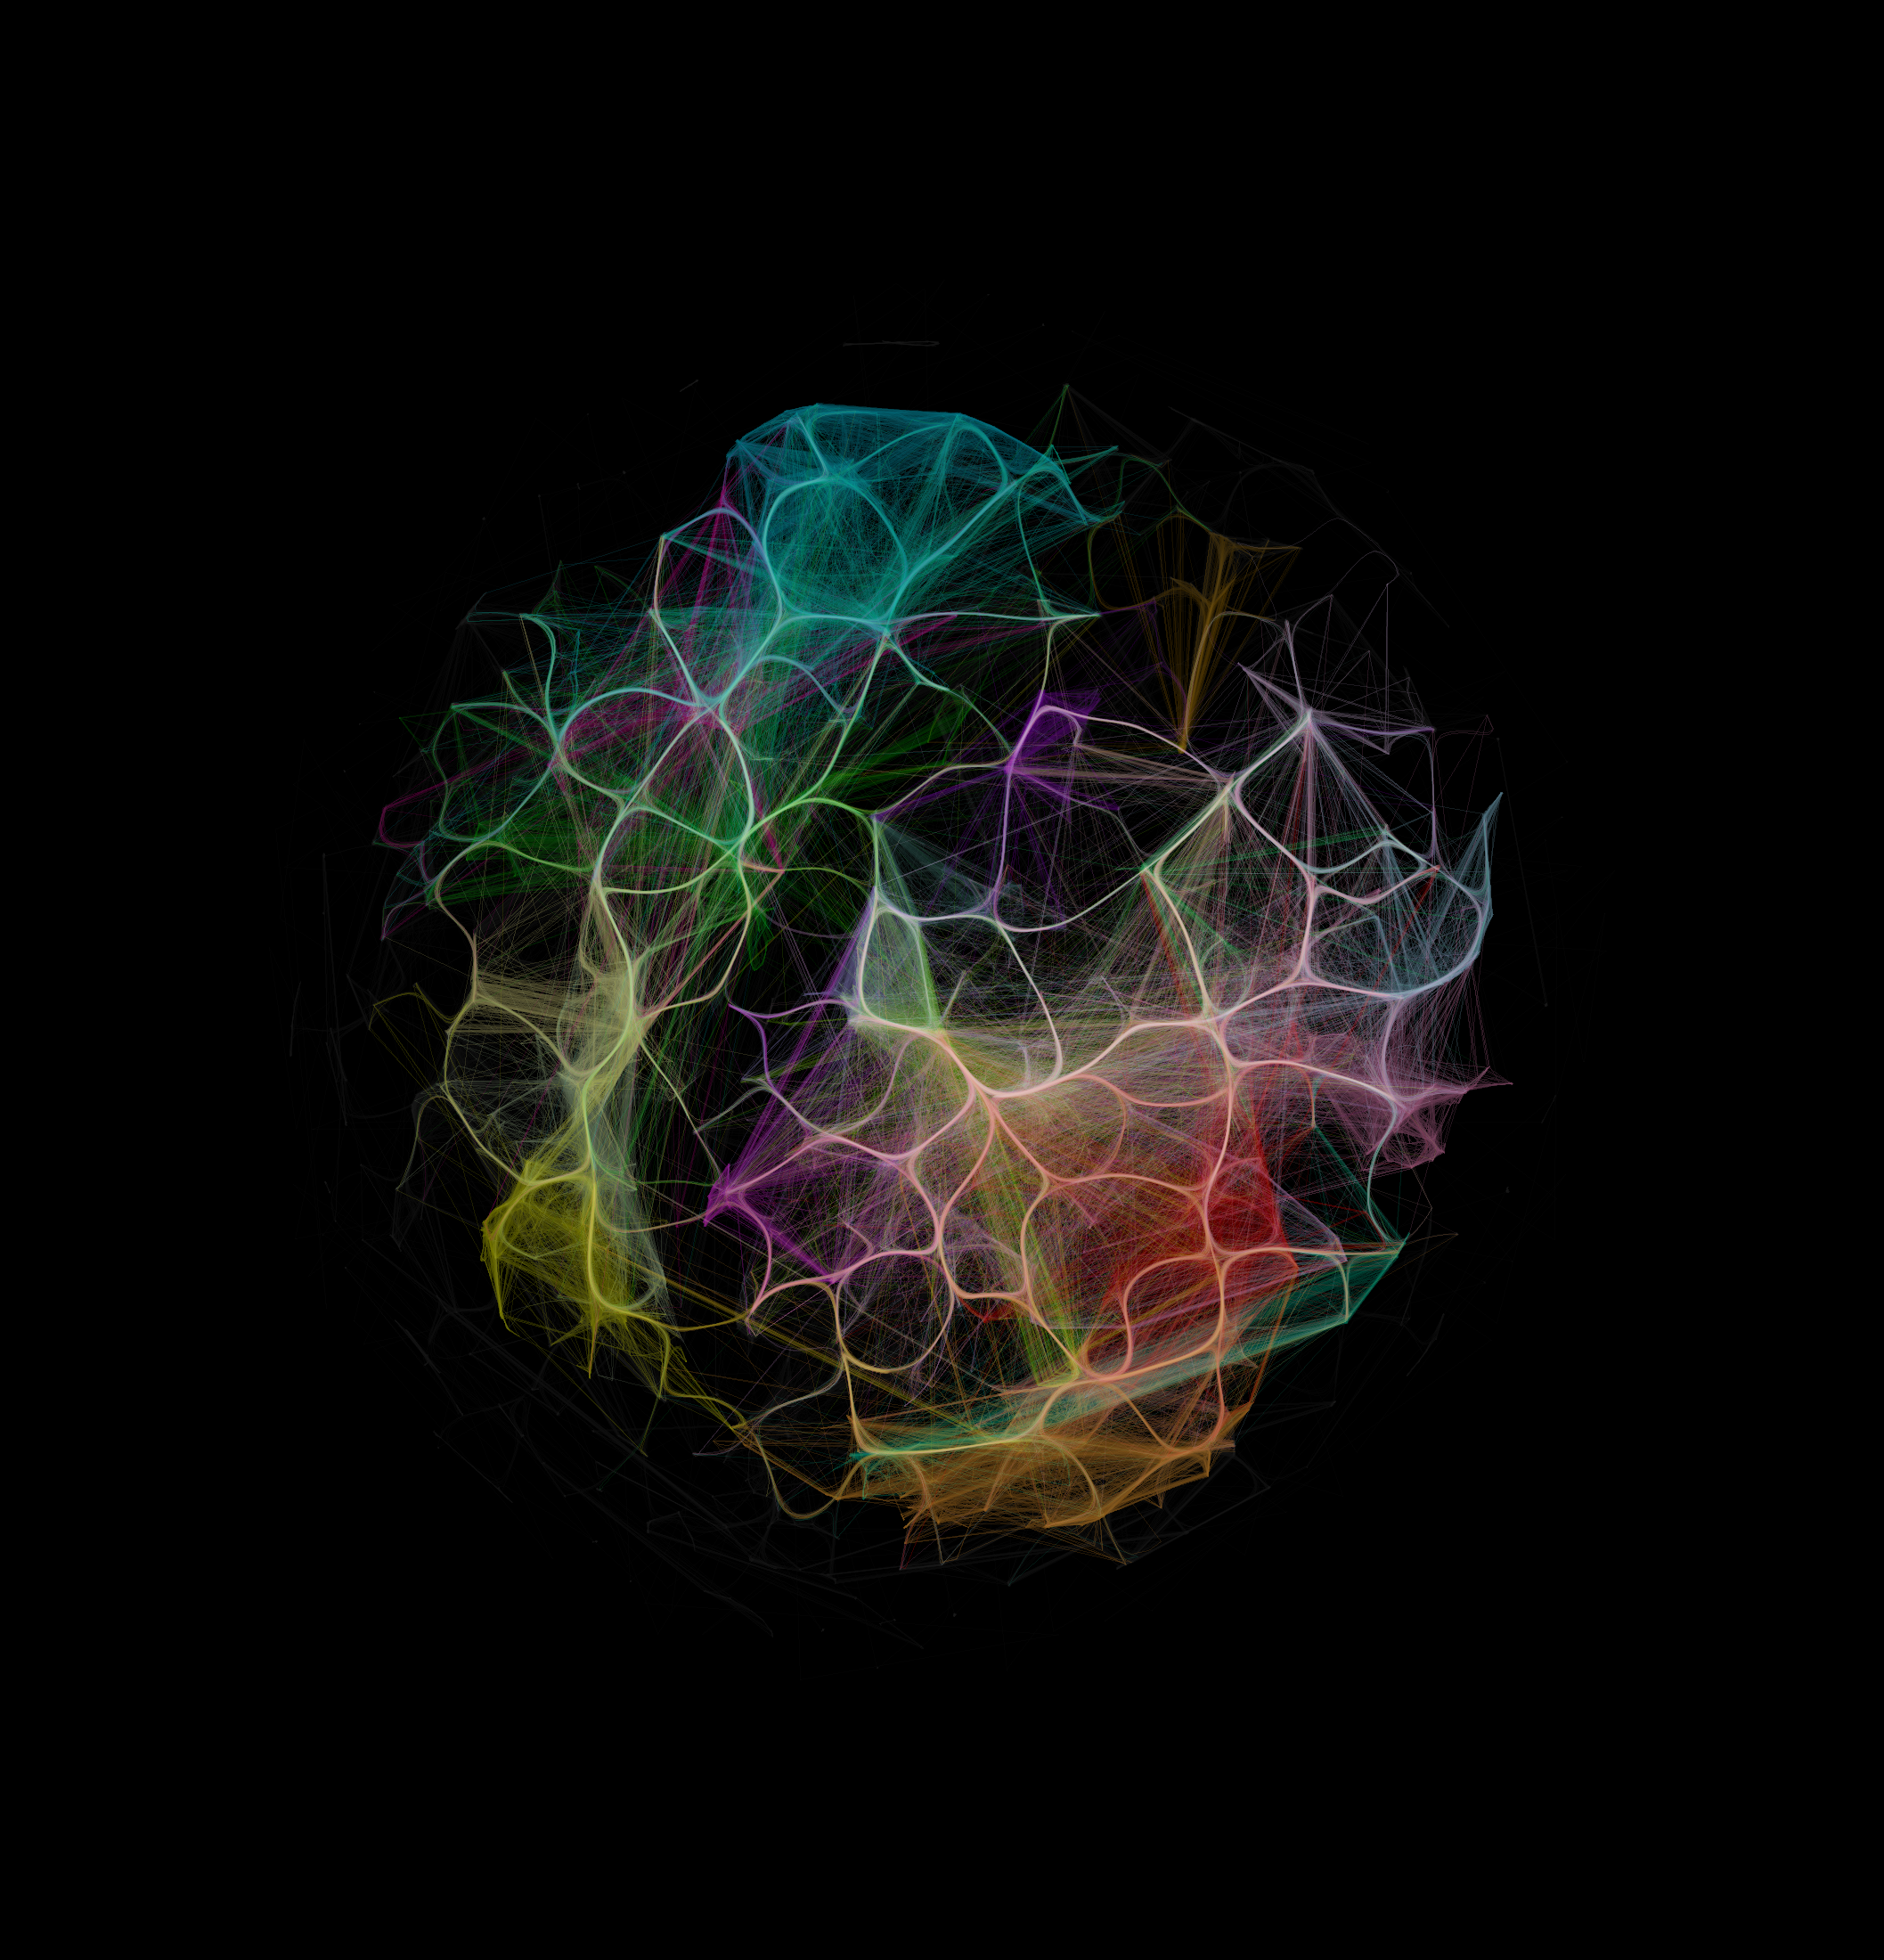
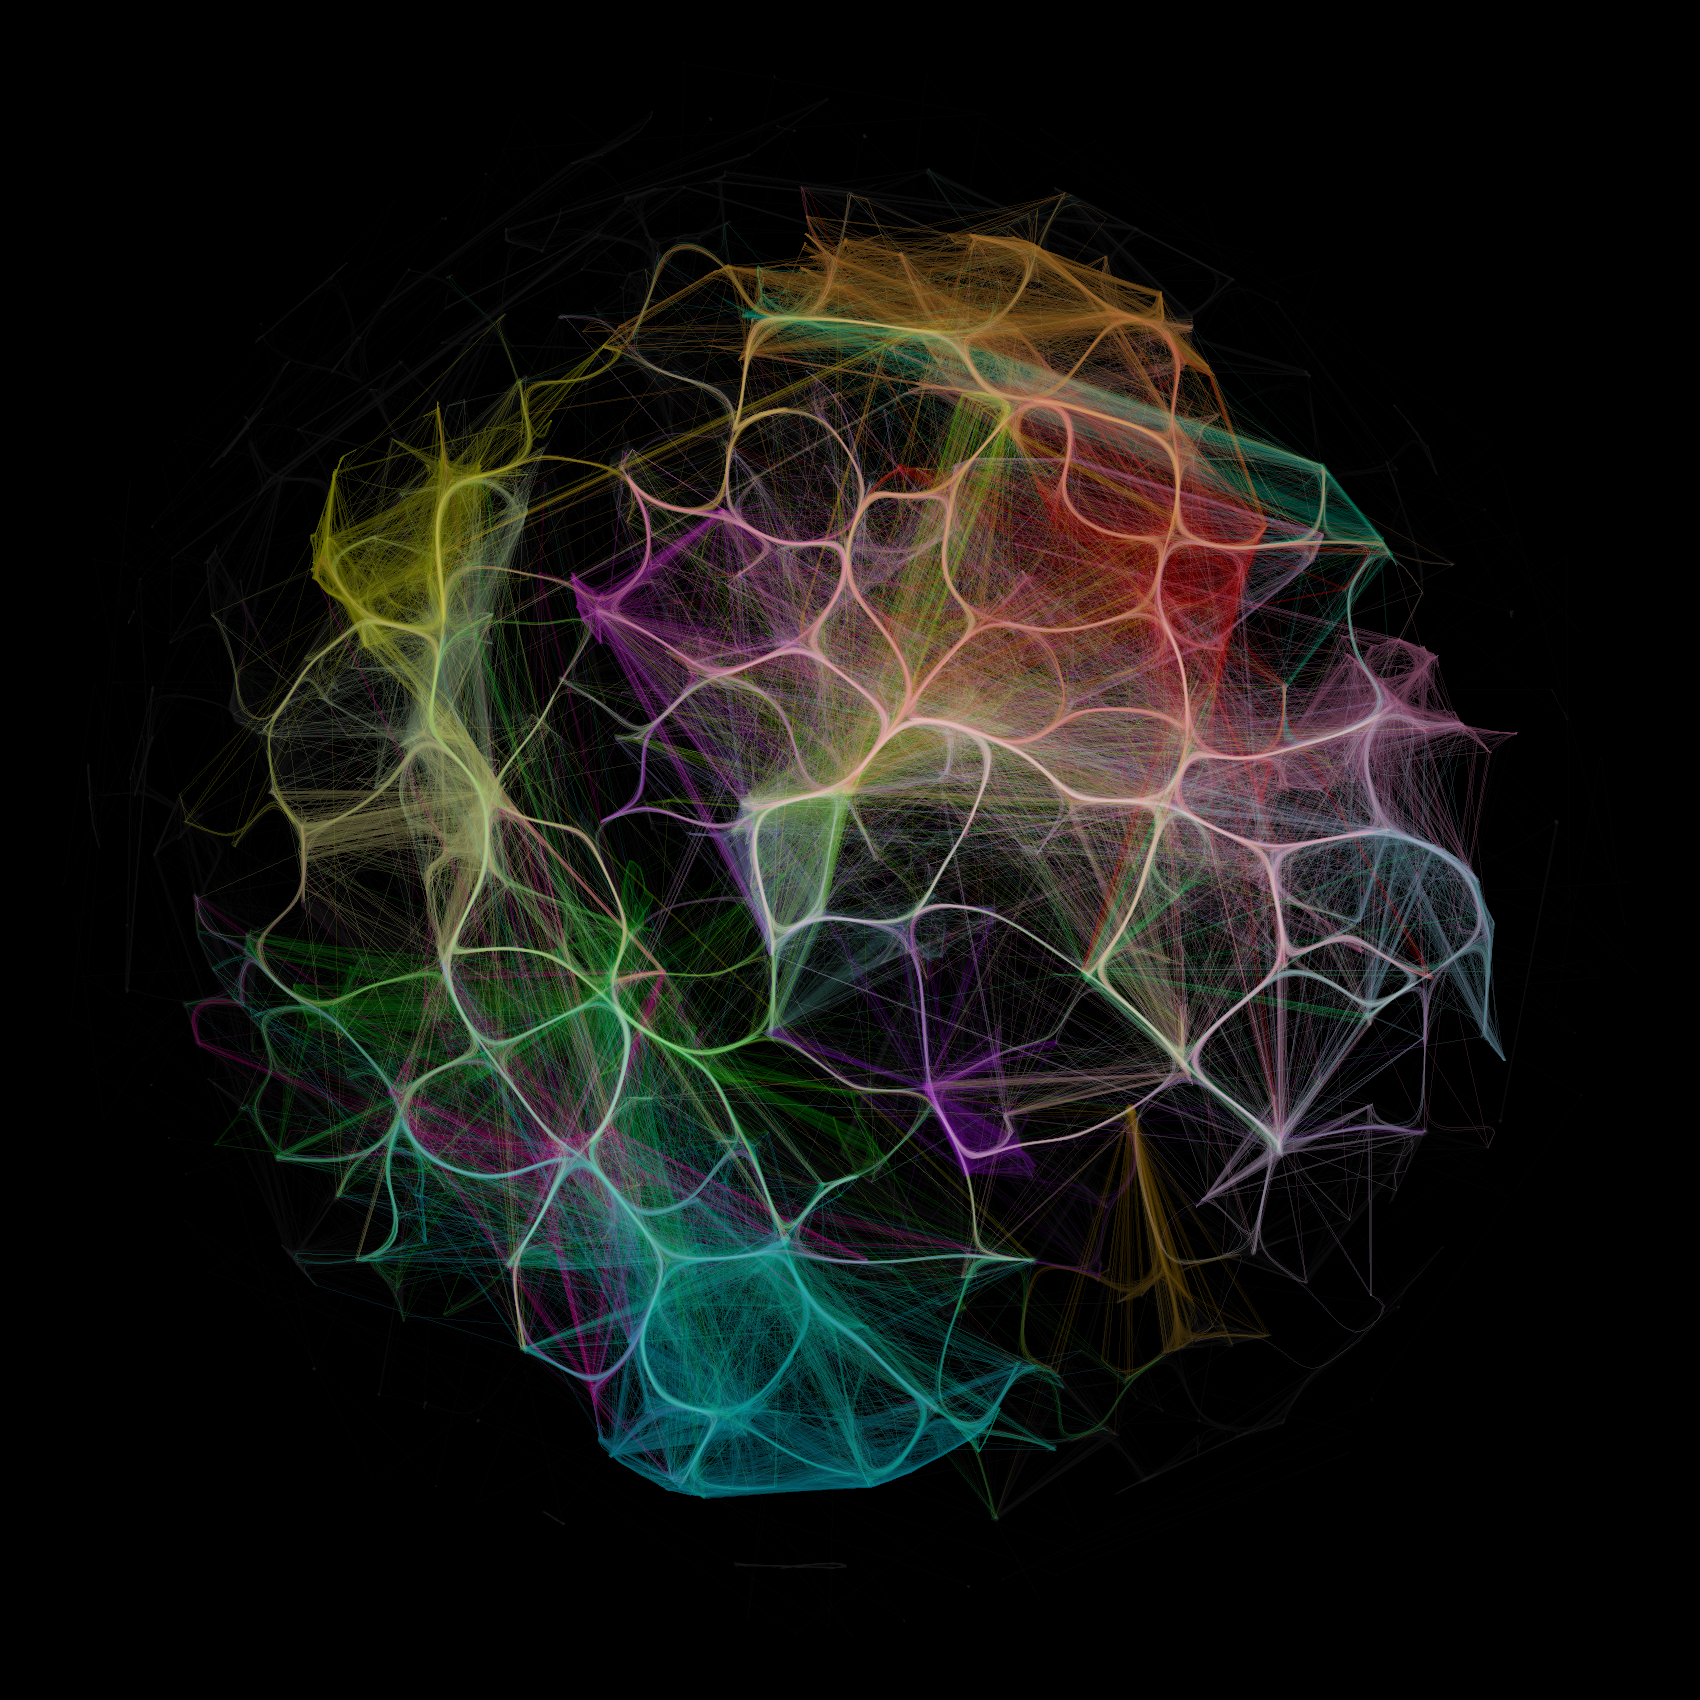
The result is the picture below: 103,923 runners in bundled strands, gathered into coloured groups. The colours are not clubs, and we did not assign them. They are the network's own communities, found by the algorithm. Read what is inside each one and they turn out to be places: Surrey, South Wales, the North-West. People mostly race close to home, so the map of who-races-whom is close to a map of Britain.
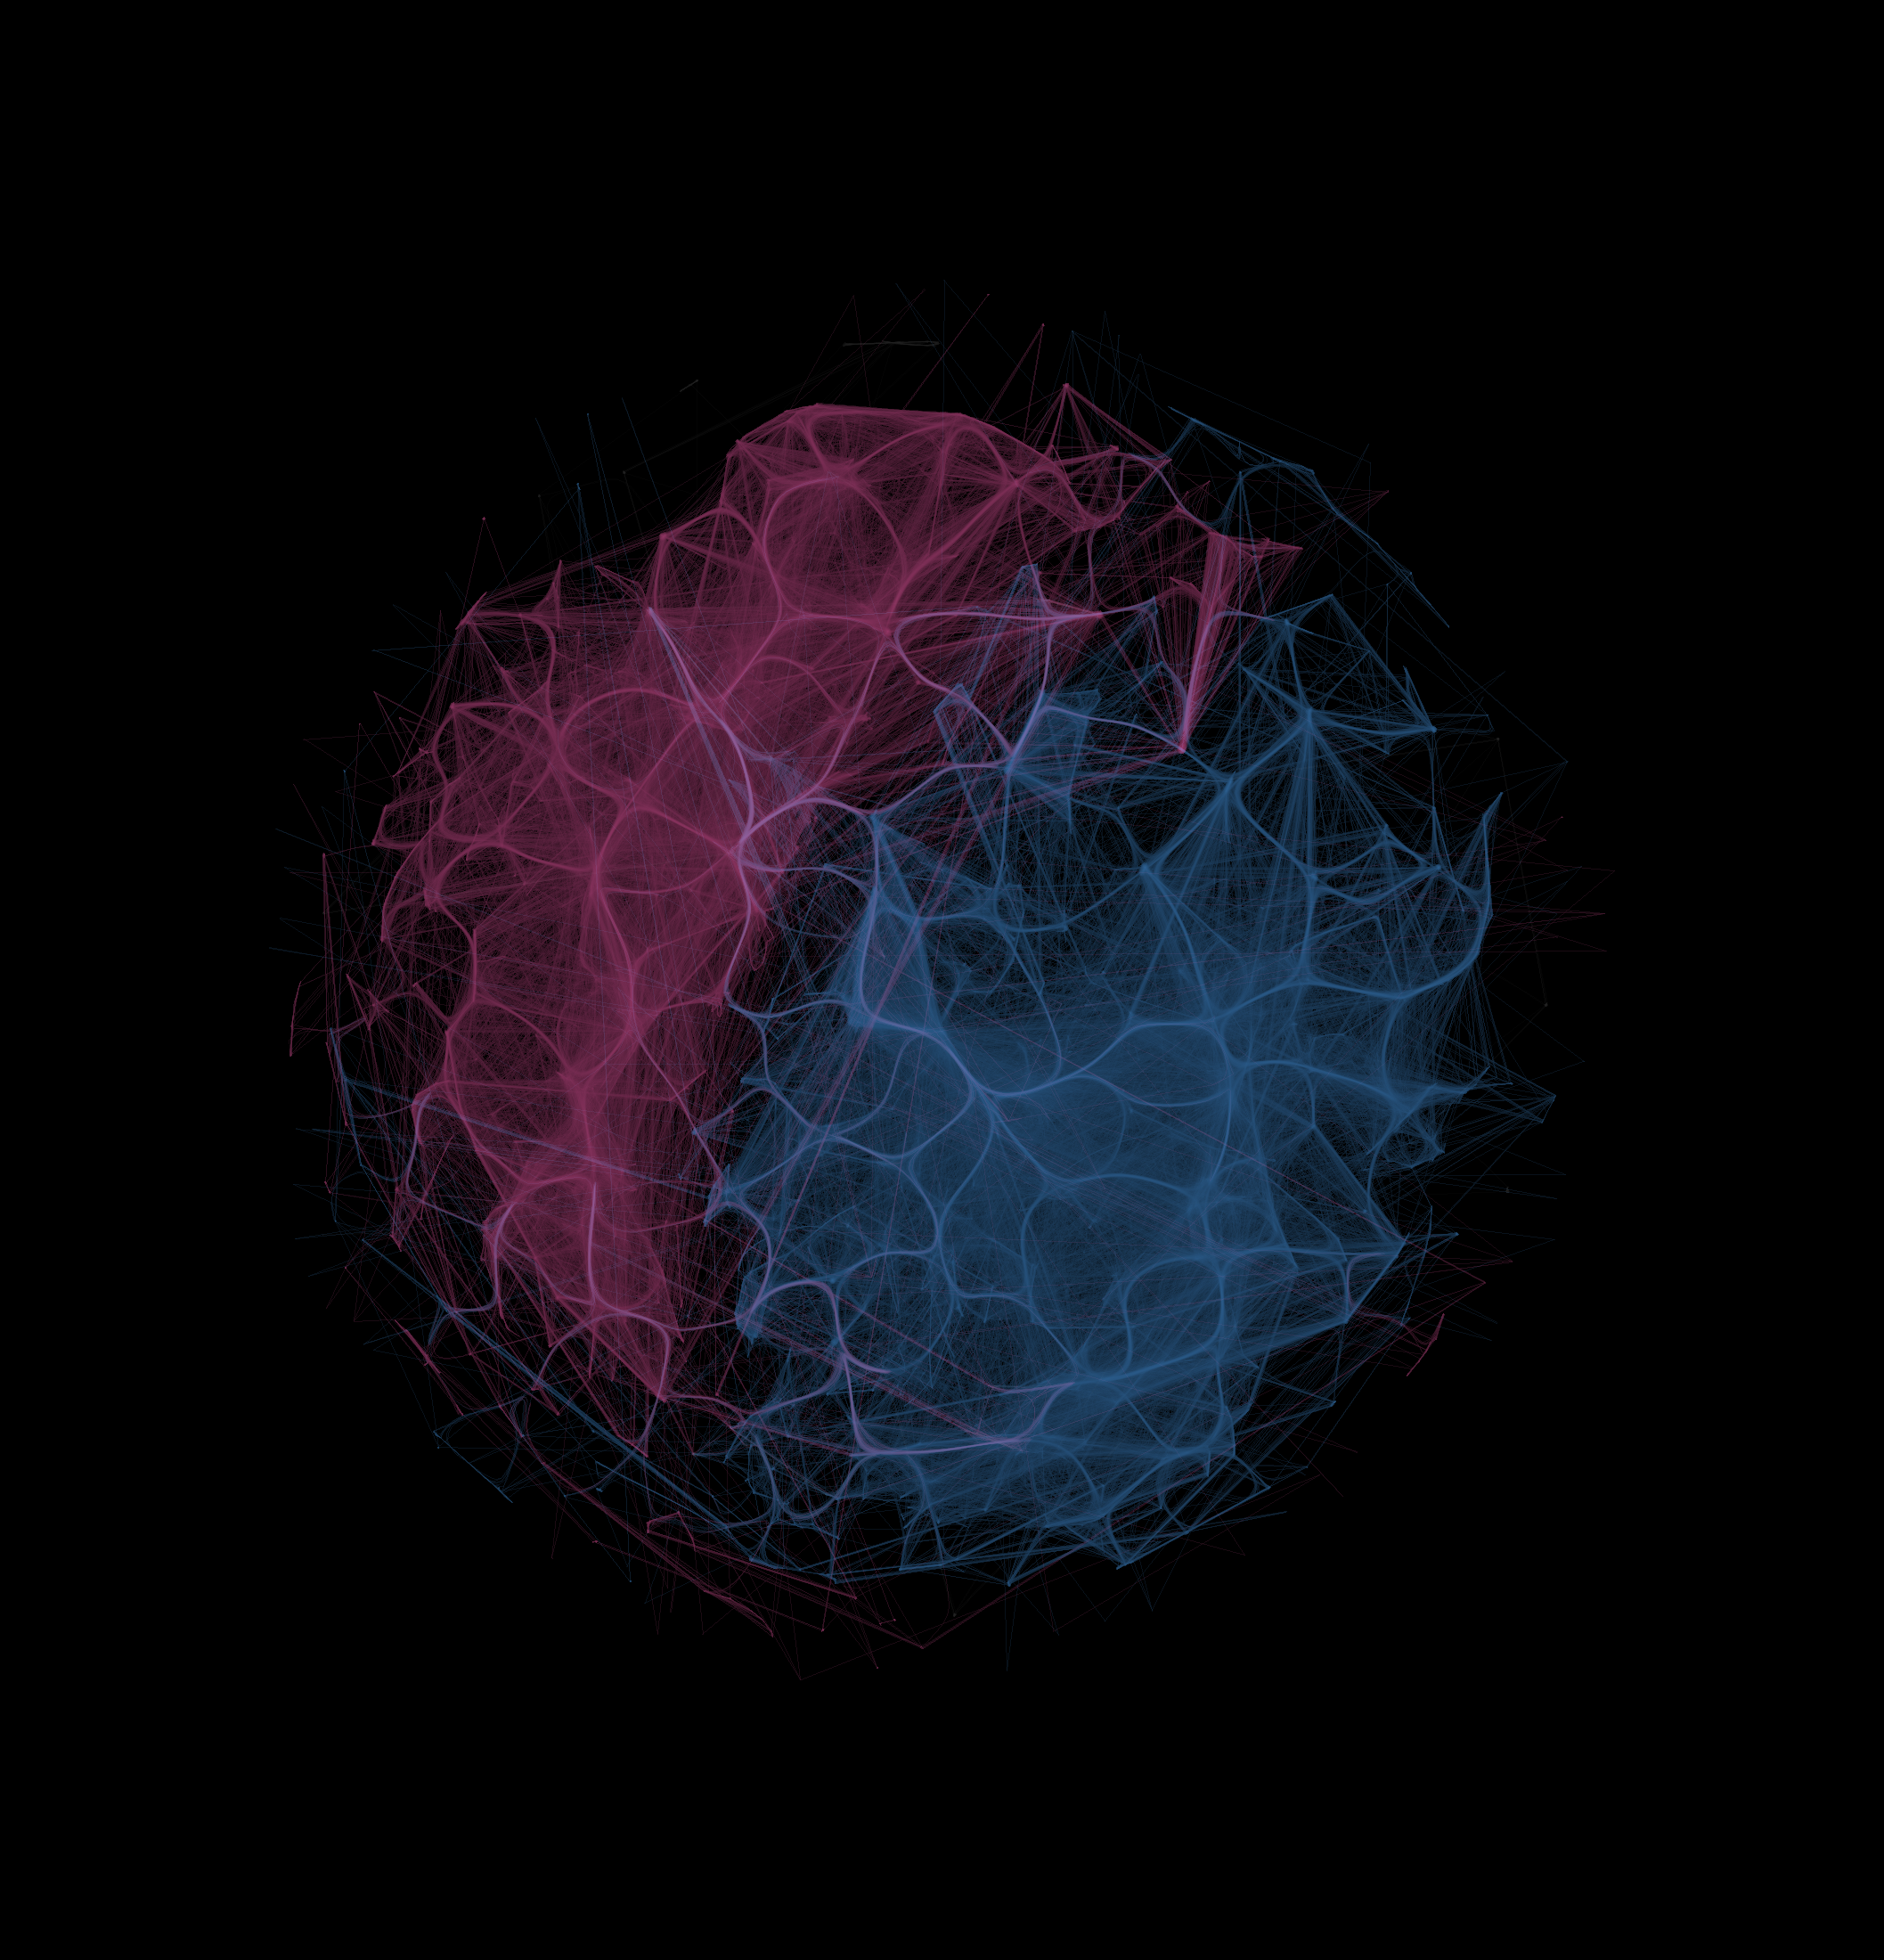
Use the buttons to recolour the whole network. The last scheme, Men · Women, is the most revealing: most races are single-sex, so the layout separates into two lobes on its own, with a blended zone where the two meet.
What you're looking at
- Each point is a runner, resolved to one identity across every league and season, so nobody is counted twice after a club change.
- Each line is a shared race (same event, age group and heat). Brighter, heavier strands are rivals who have met many times.
- The layout uses no map and no coordinates. It pulls well-connected runners together, and clubs and circuits form their own knots.
- The default colour is community, not club. A Louvain pass finds the groups that race each other most, and the 24 biggest get a colour; the rest are the dim web behind them.
How it was made
Four steps, one idea each. Scroll — the picture builds as you go.
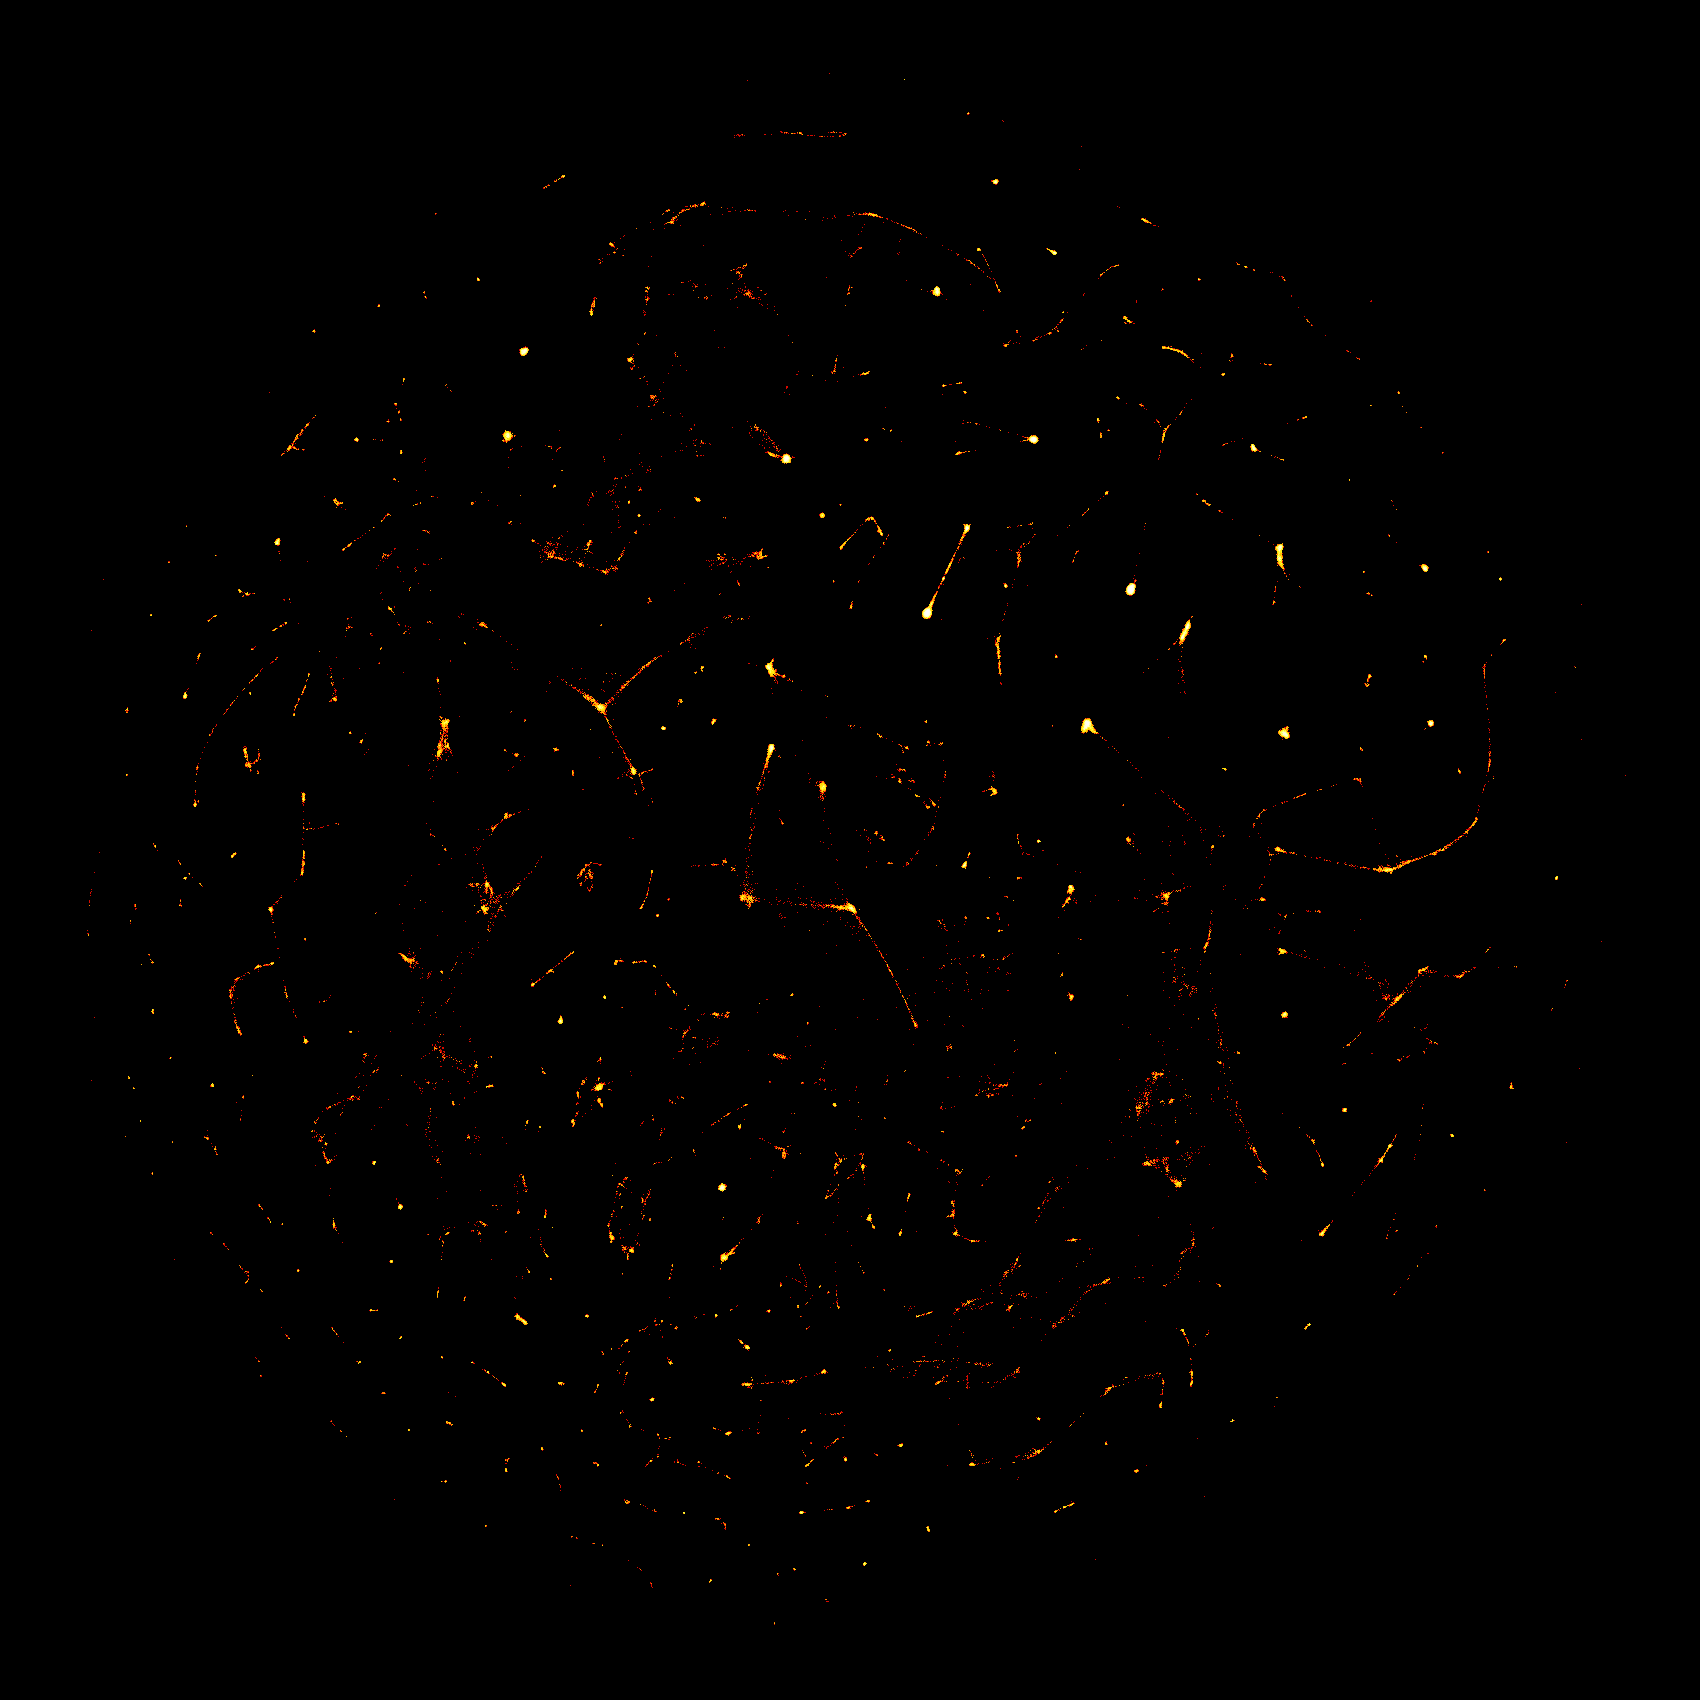
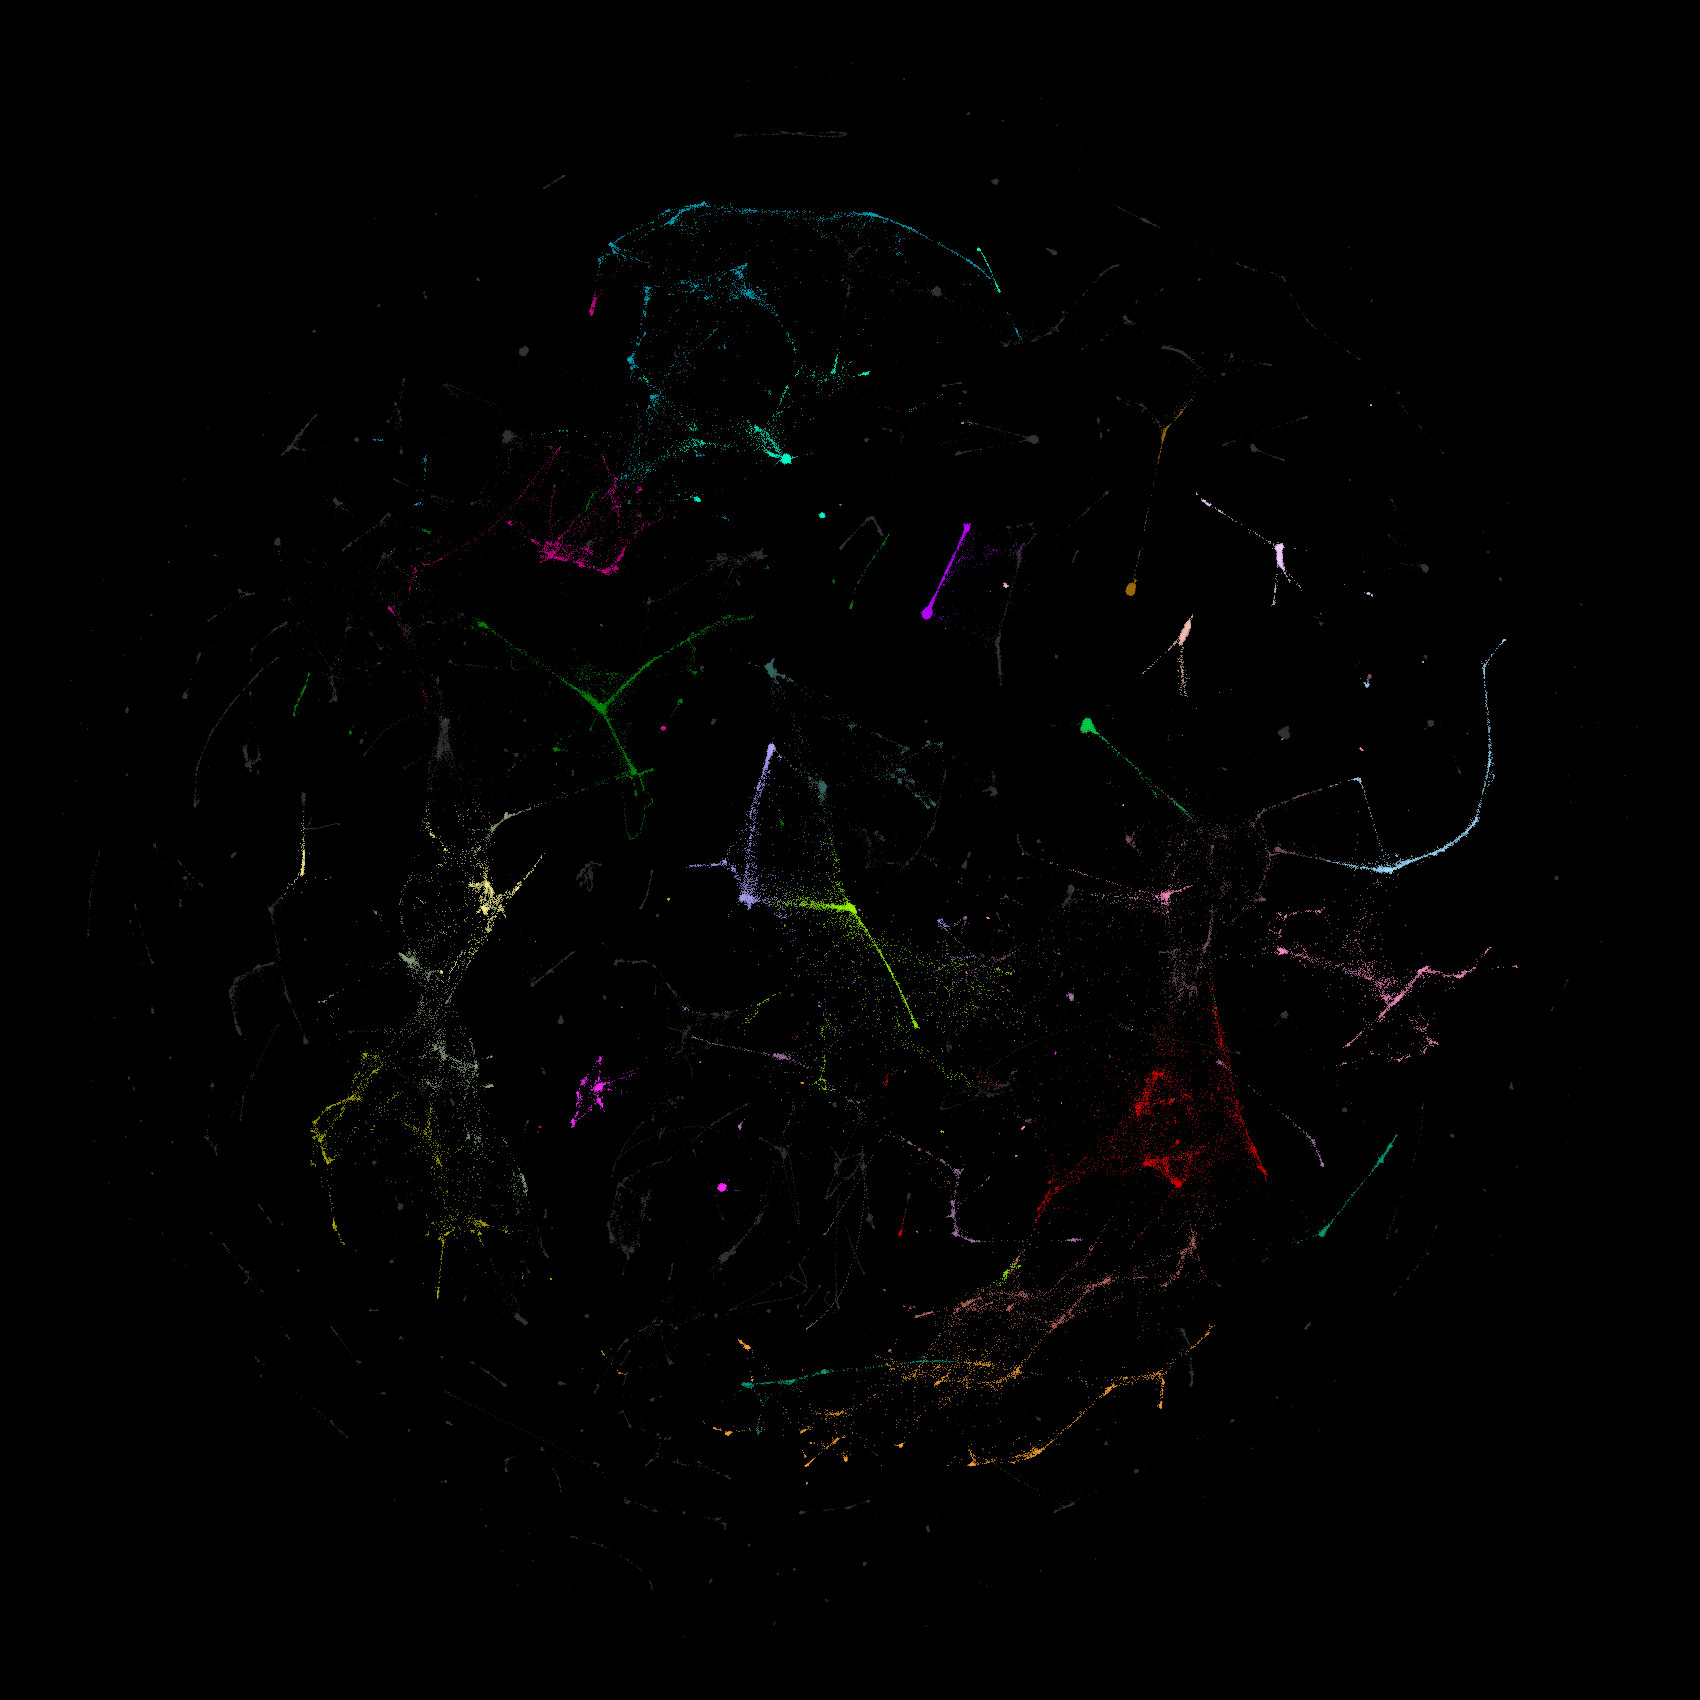
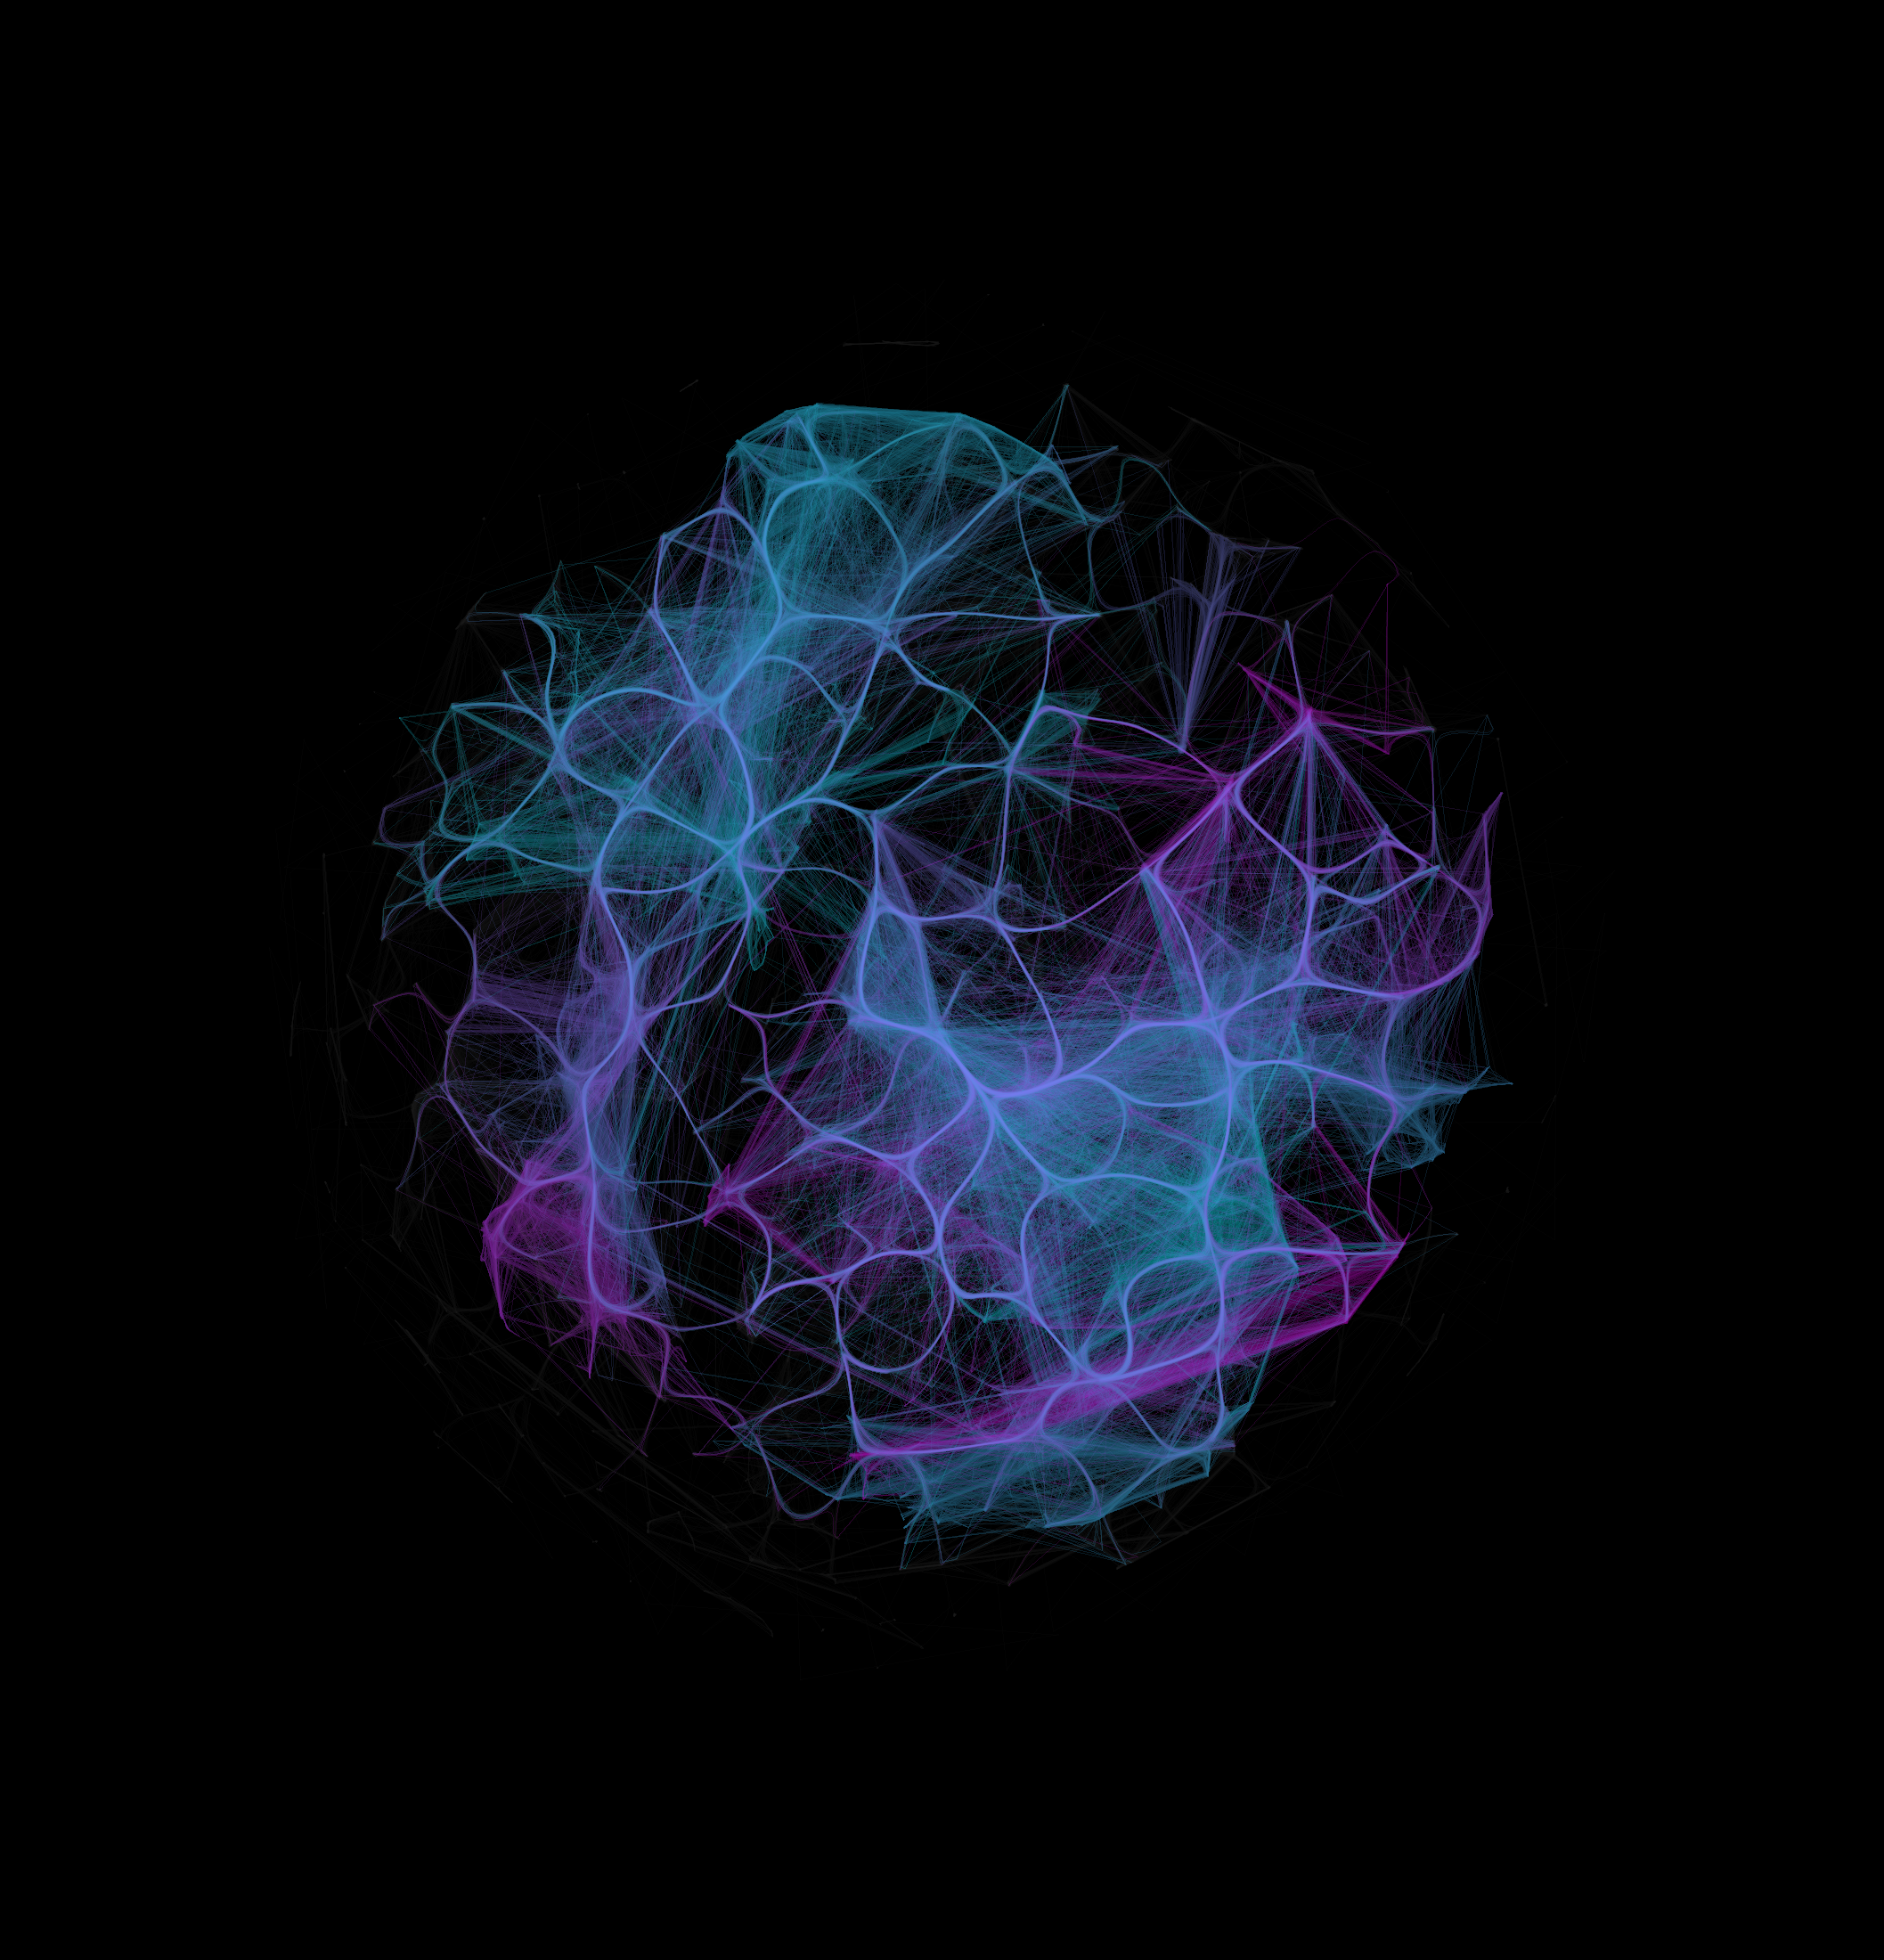
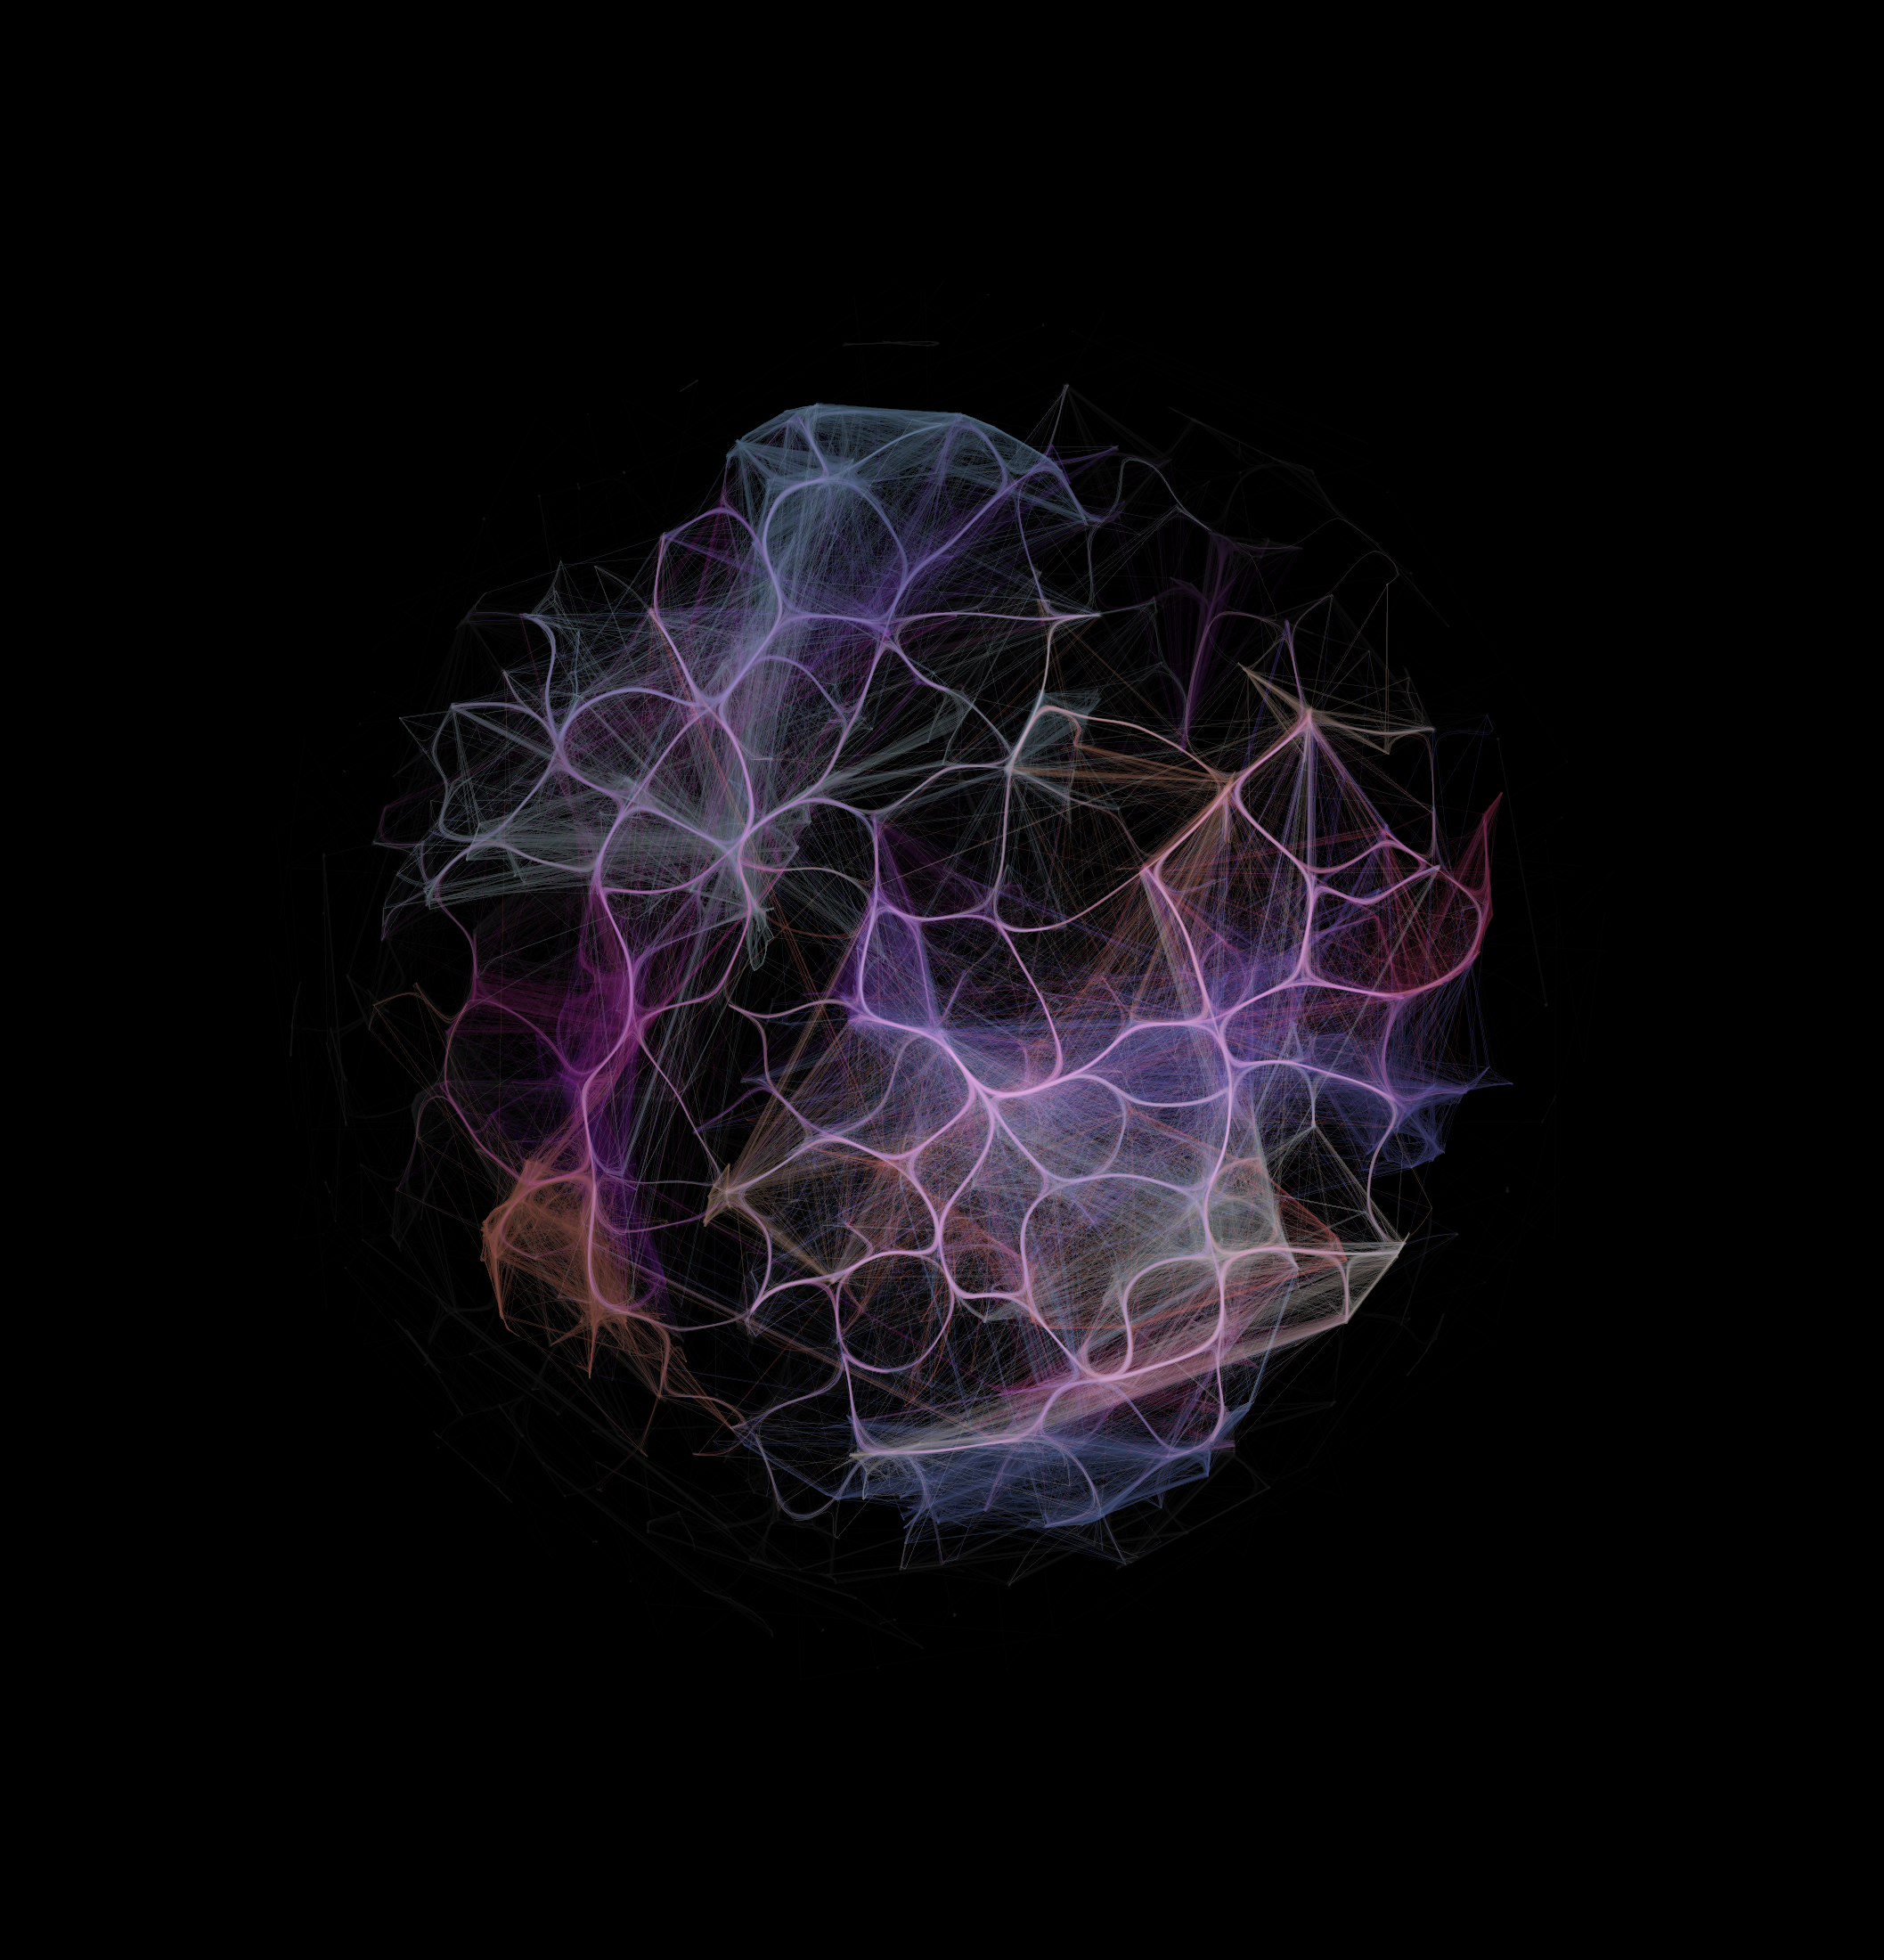
1 — Is there structure? Lay the runners out and shade by density. Bright knots and connecting filaments appear straight away: real cores and bridges, not a featureless blob.
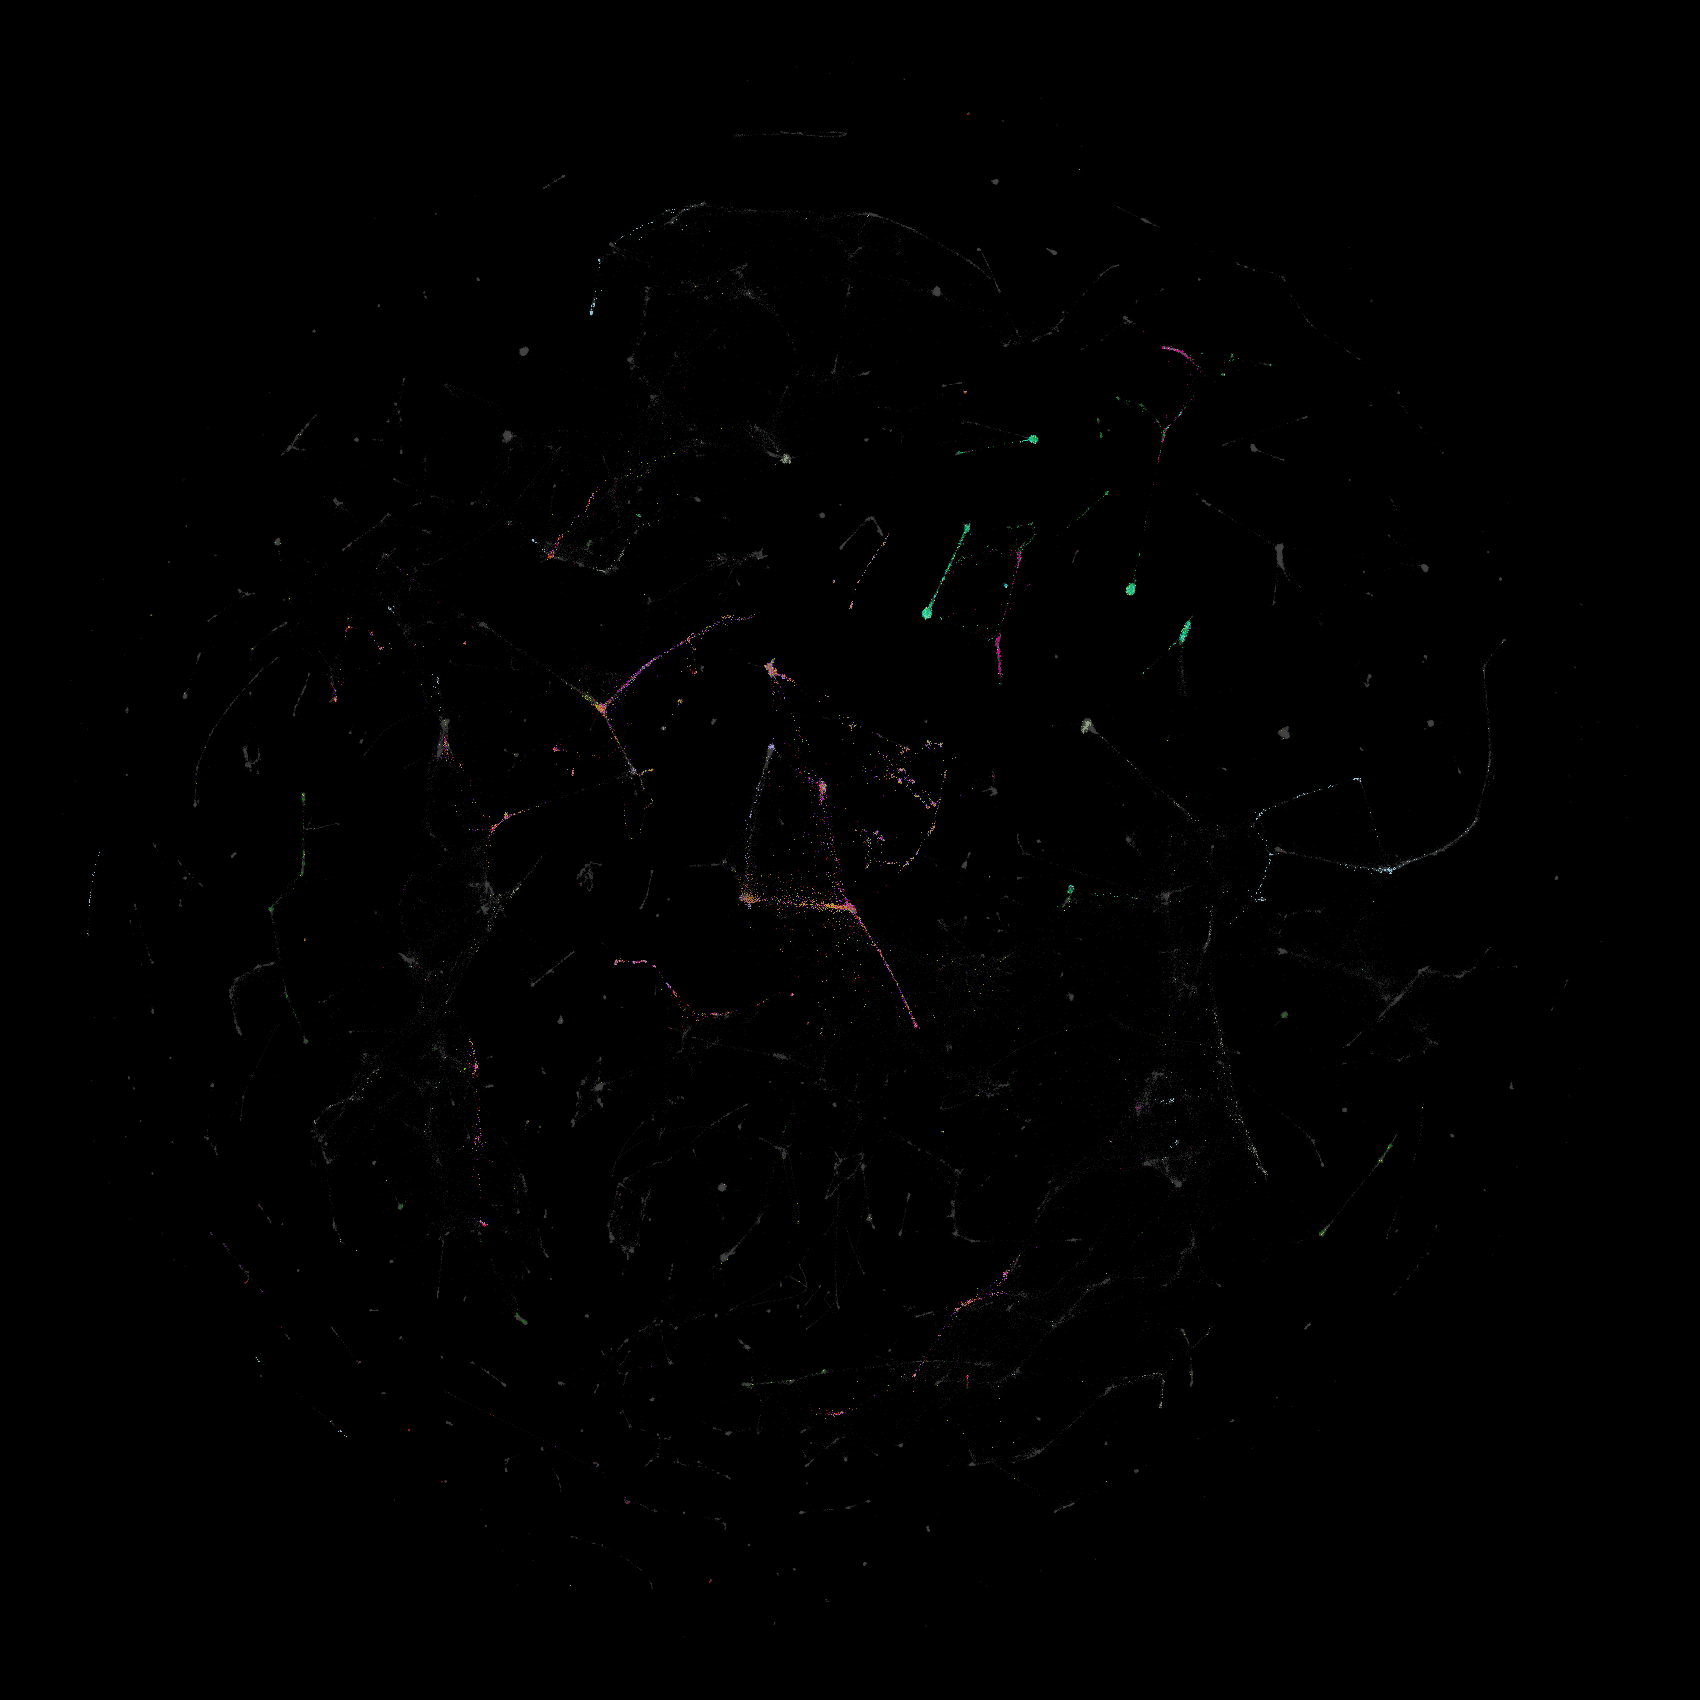
2 — Colour by club? The obvious choice lights up about 9% of the points and leaves the rest grey. Clubs are too small to be the factions.
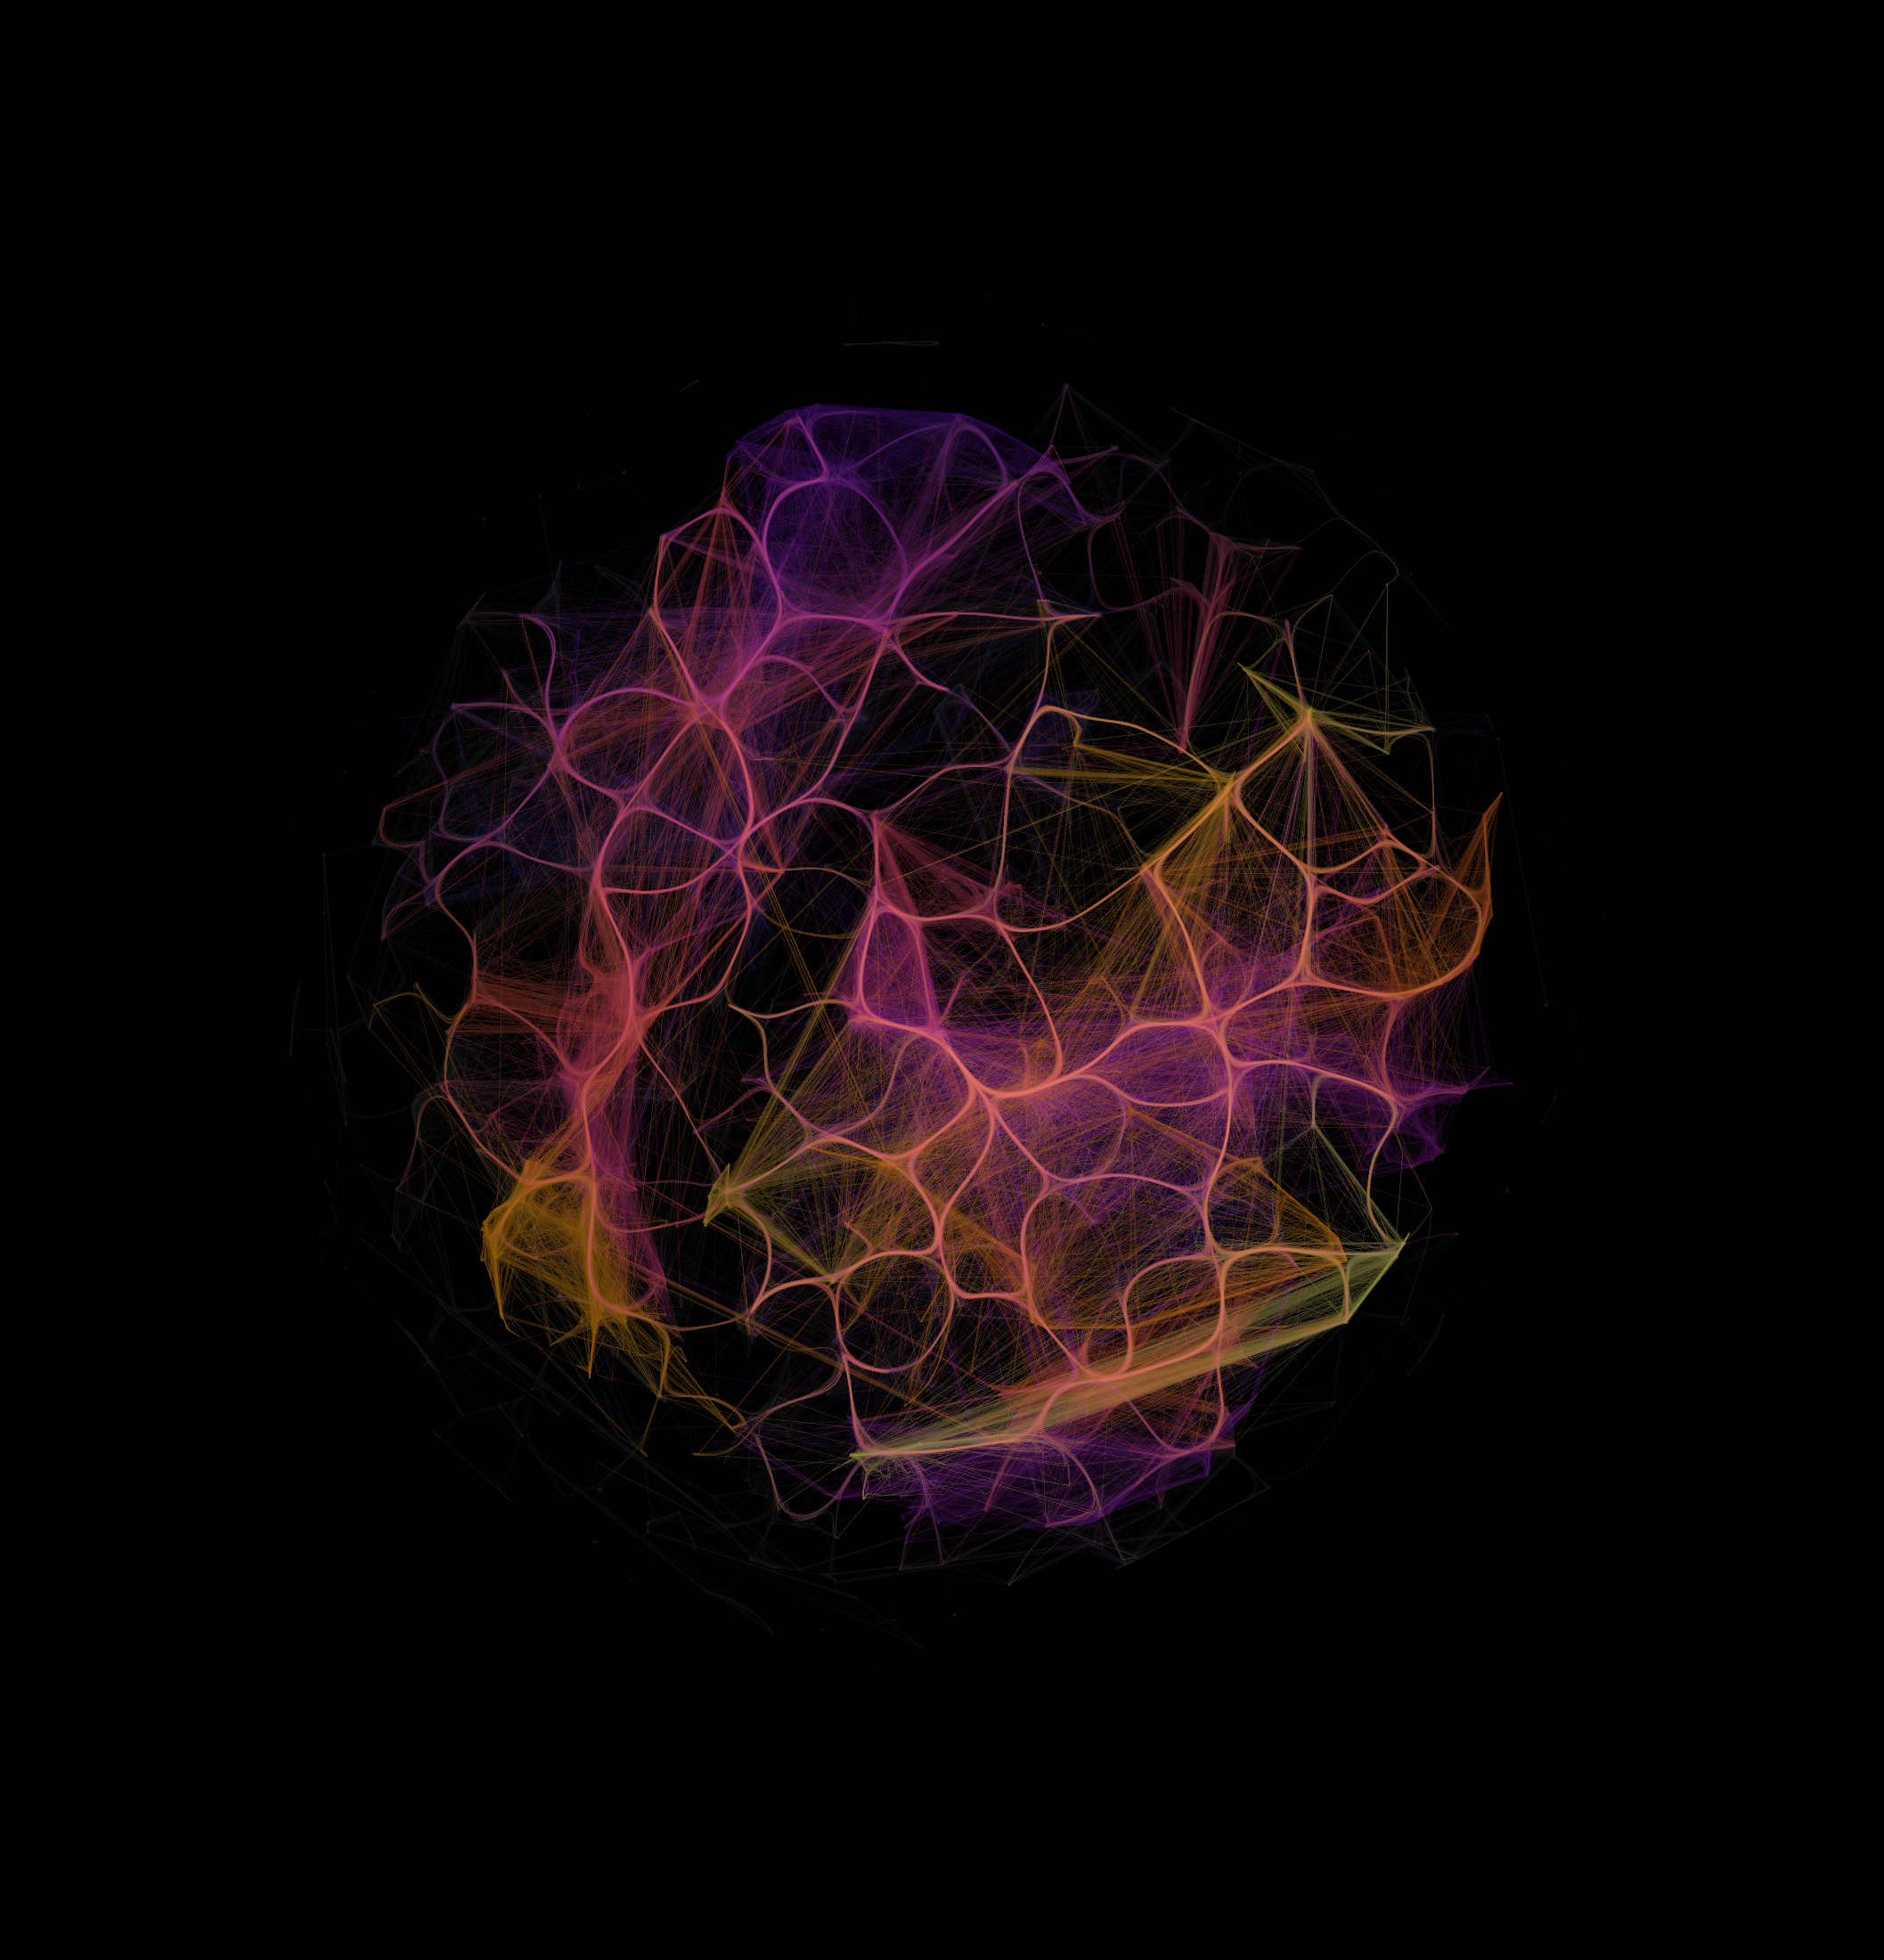
3 — Colour by community. Let the graph define its own groups, and the colour fills the whole structure. The communities are the dense knots.
4 — Bundle the edges. Pull the race-links into flowing strands and let the overlaps glow. This is the hero image.
The communities are places
Read the clubs inside each community and the abstract groups turn into the racing geography of Britain. No single club dominates; each community is a circuit of clubs that share start lines:
- North-West England: Preston, Liverpool Pembroke Sefton, Lancaster & Morecambe, Vale Royal, Blackburn.
- Surrey and South London: South London Harriers, Herne Hill, Belgrave, Ranelagh, Guildford & Godalming, Woking. The Surrey League cluster.
- South Wales and the Severn: Les Croupiers, Westbury, Bristol & West, Lliswerry, Swansea, Chepstow.
Place each runner at their club's real location instead of the force-layout, and the network takes the shape of the country: Great Britain on the right, Ireland faint across the Irish Sea.
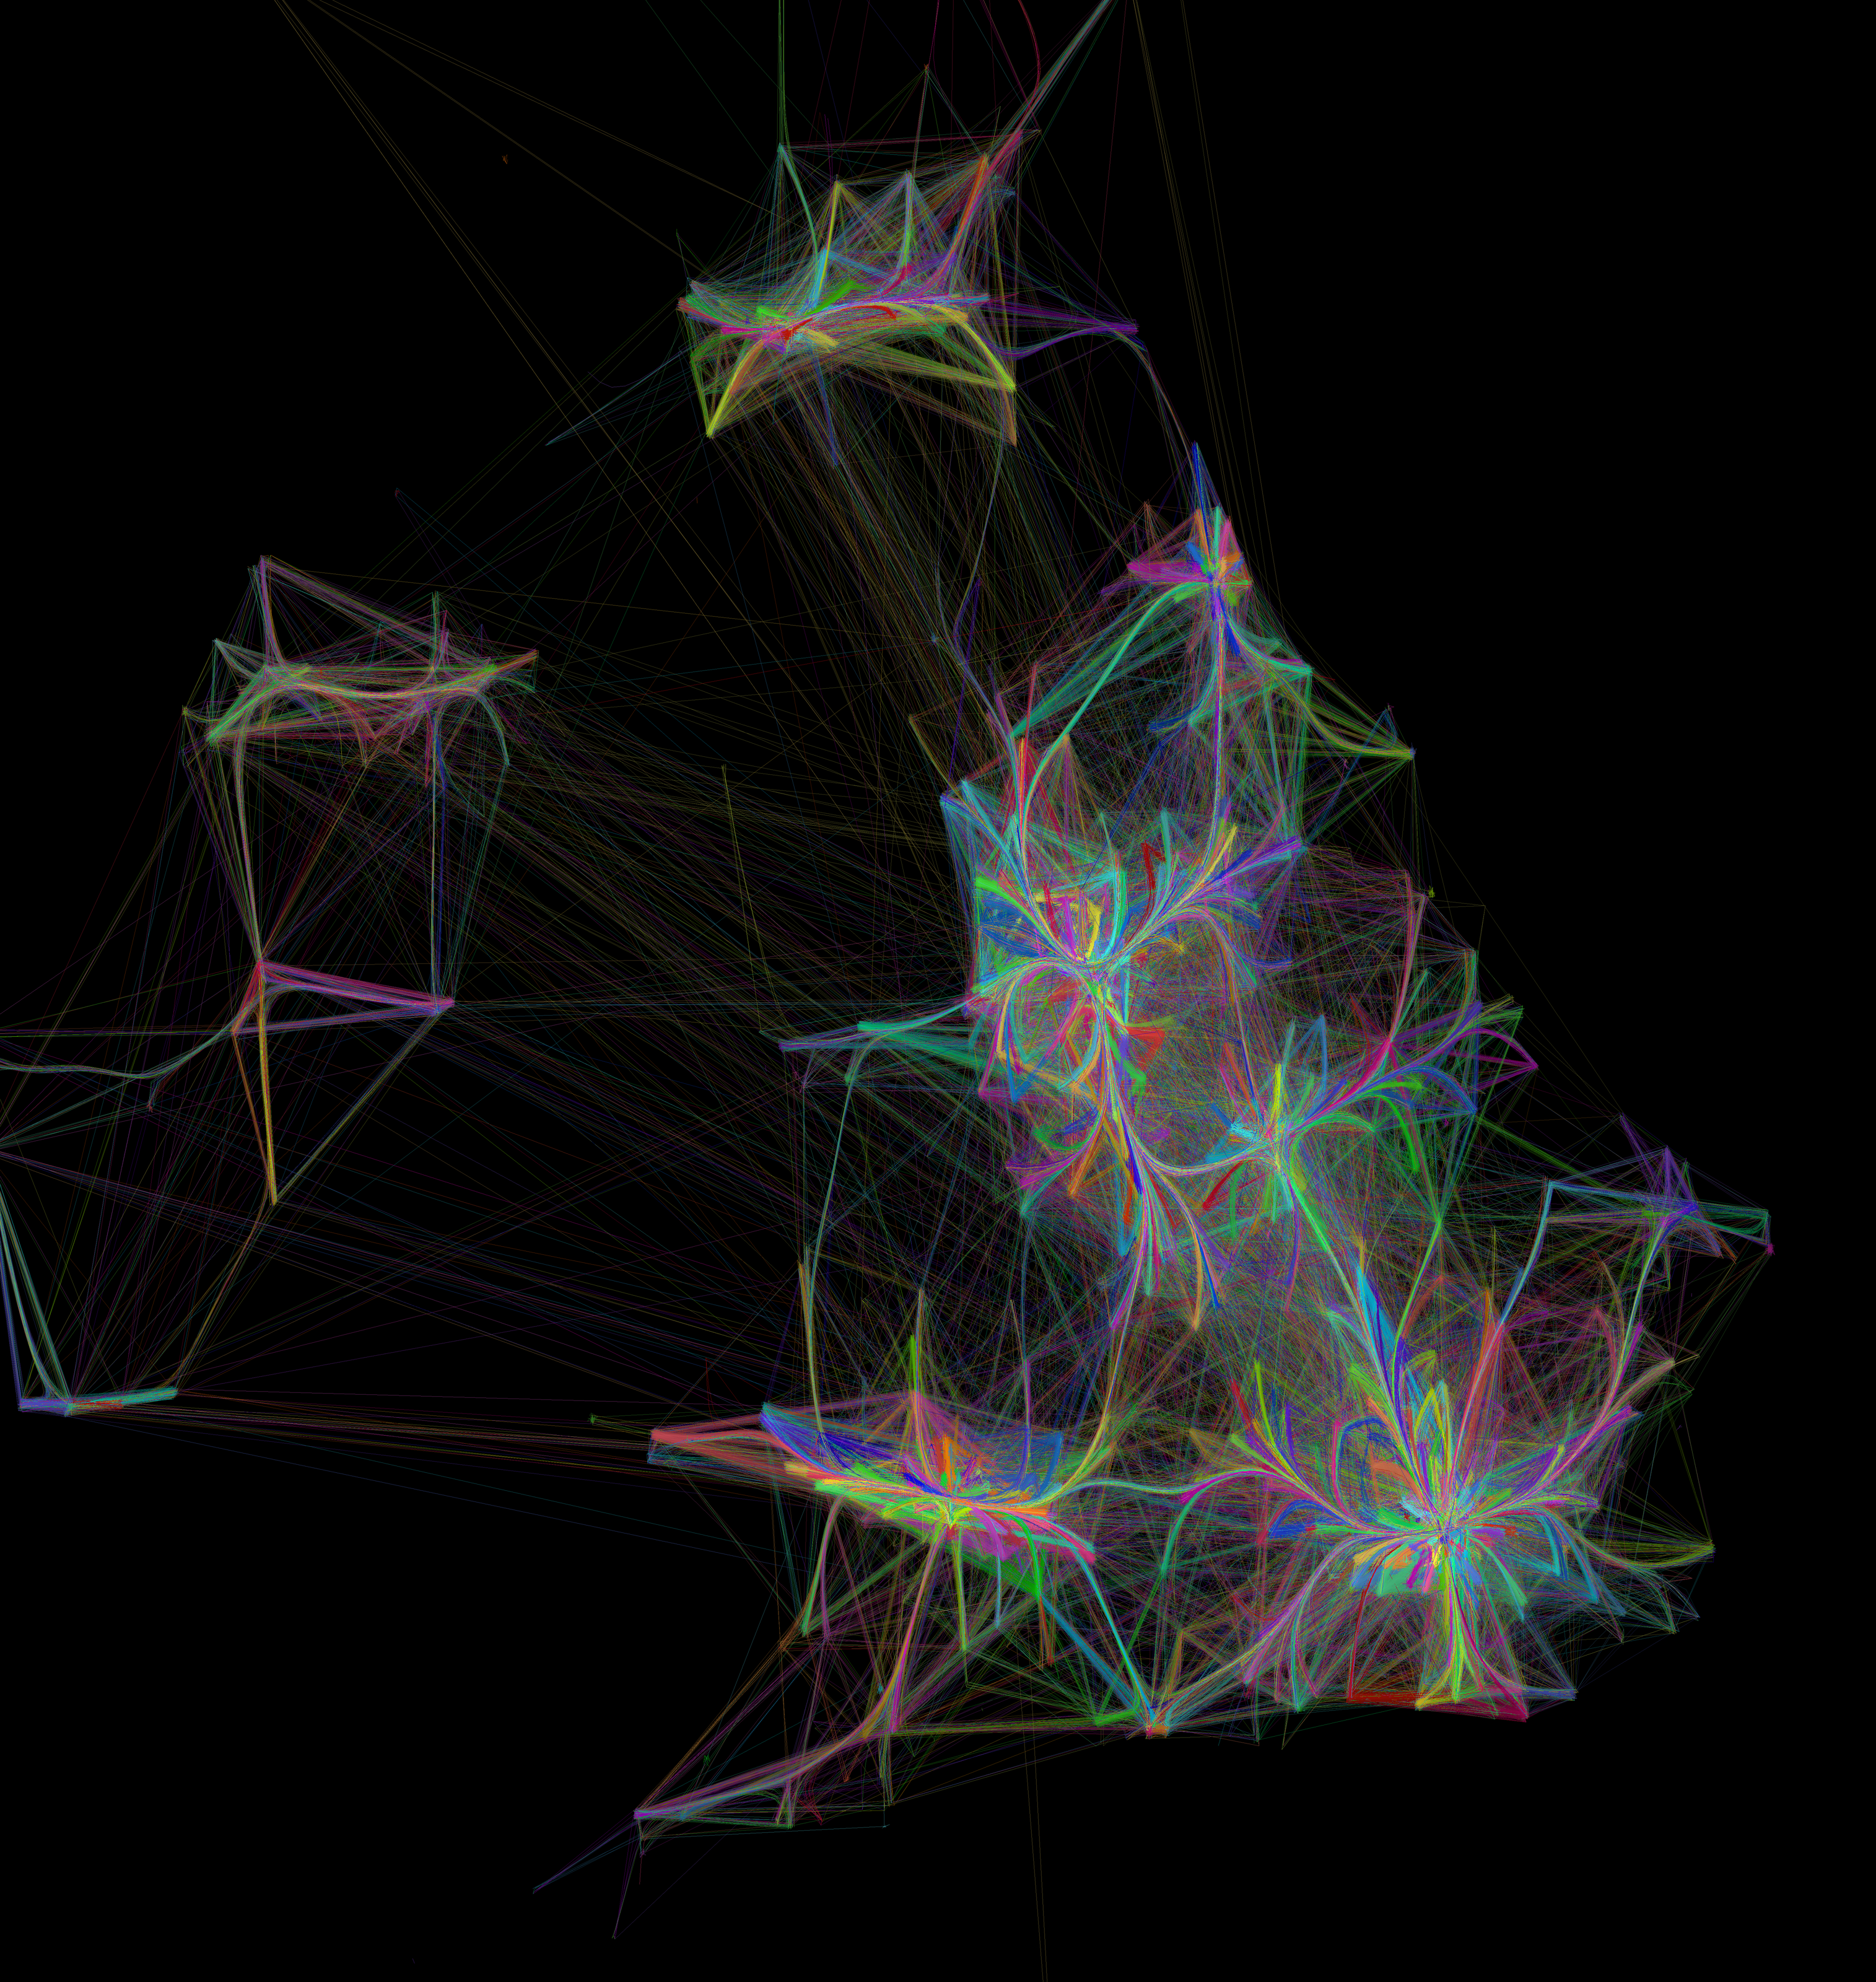
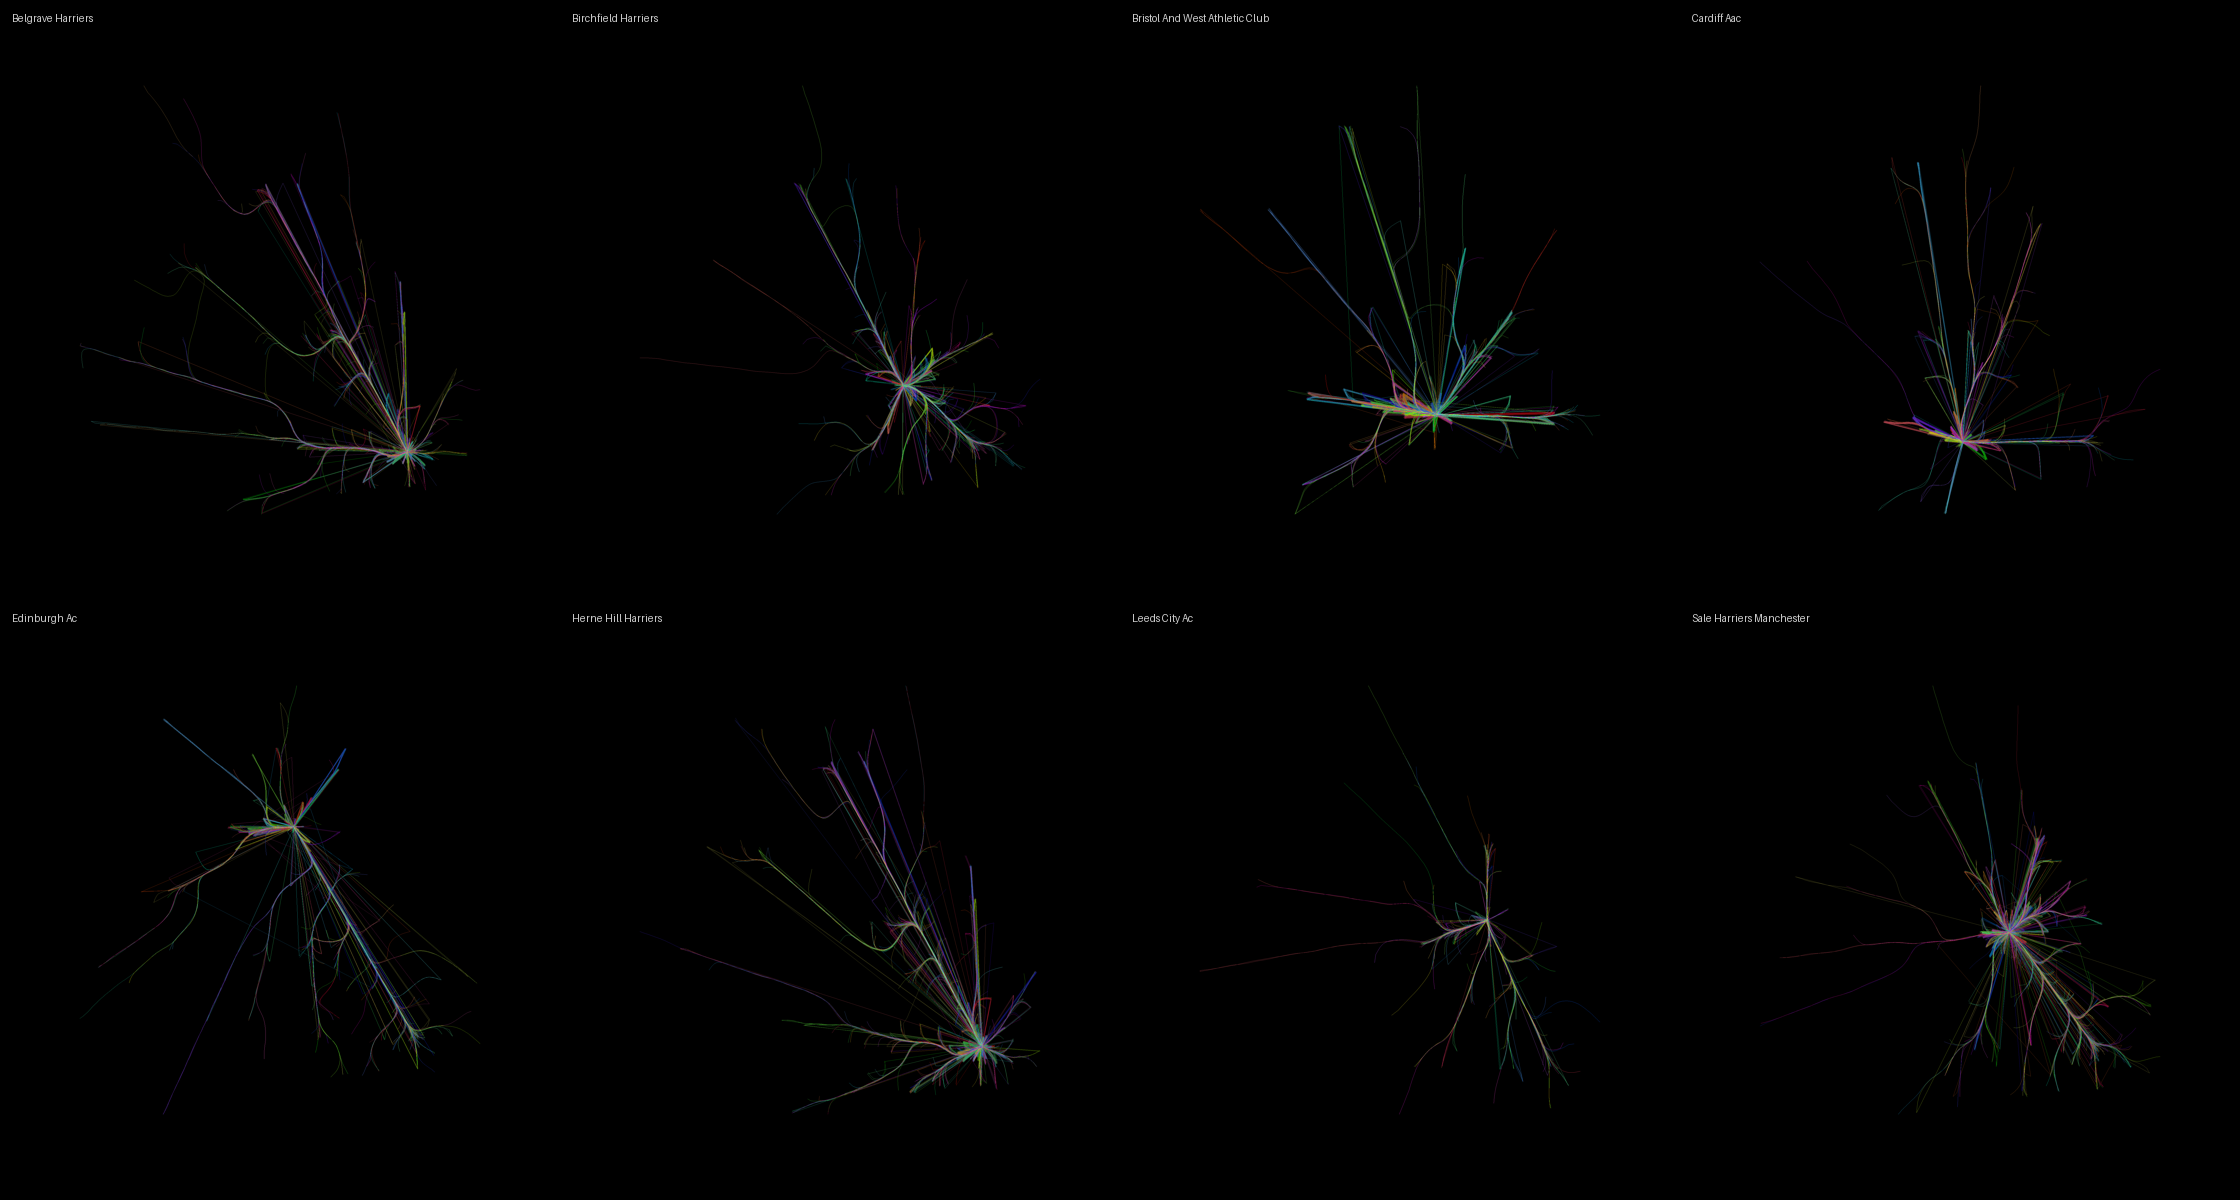
Every club has a footprint
Take a single club and keep only the races its runners ran, and you get that club's footprint: a bright home knot where most of its racing happens, with strands reaching out to wherever its runners travel, the nationals and the big championships included. Each strand is coloured by the club they raced.
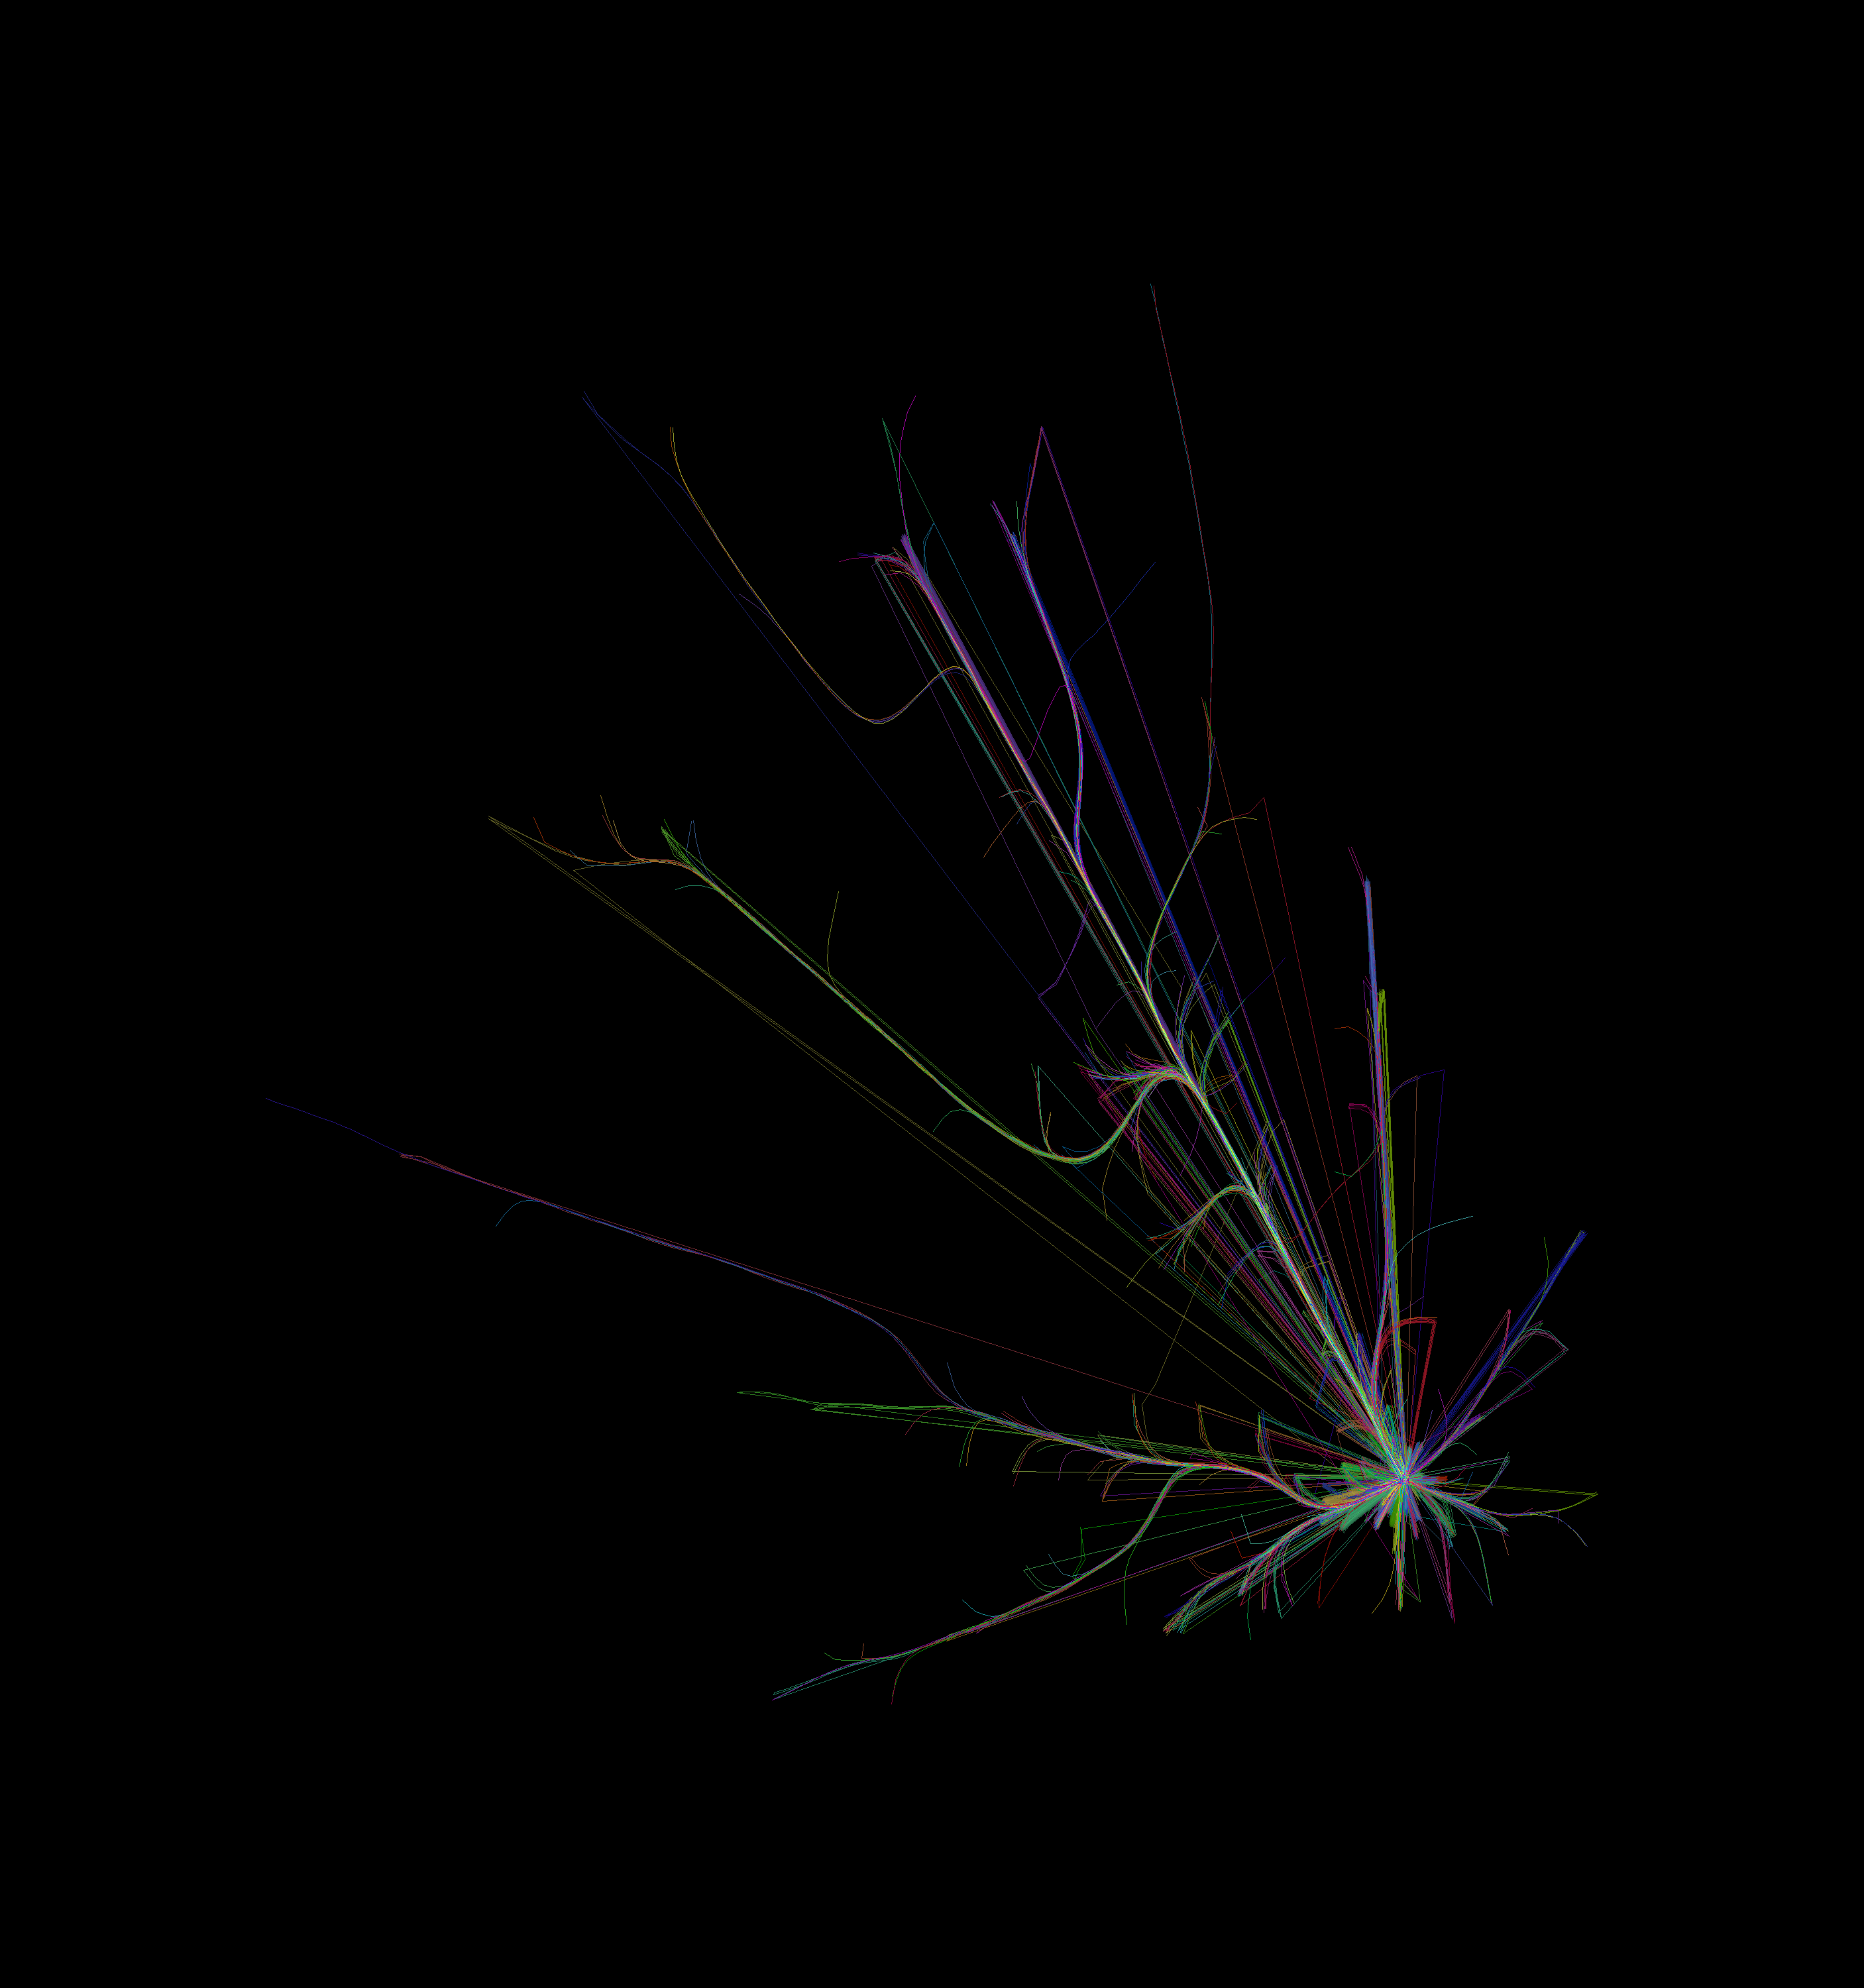
The home knot sits somewhere different for every club, so together they trace the country: Edinburgh in the north, Cardiff in the west, Sale in the north-west, Bristol & West in the south-west.
Method
- Data. 850,699 results across 56 sources (cross-country leagues, county and national championships, track), each runner resolved to a stable identity by the cross-country ratings registry. The archive has since grown to 1.3 million results across 64 sources; the renders on this page are the 850k snapshot.
- Graph. One node per runner who raced at least twice, one edge per pair who shared a race, weighted by meetings. Keeping each runner's strongest rivalries leaves about 580,000 edges over 104,000 runners.
- Communities. Louvain community detection: 193 communities, the 24 largest coloured.
- Render. Force-directed layout, then force-directed edge bundling (datashader's hammer bundle), accumulated over black and tone-mapped so the dense cores glow without blowing out.
Map note: runners sit at their club's town. Where a club could not be geocoded, the runner is placed within their community's real area, so the regional shape holds even if a few exact pins do not.