Who'd win? Rating British cross-country from finishing order alone
In cross-country the clock is meaningless — different course, distance and mud every week — so the only thing that carries is who beat whom. We took 481,000 finishing positions from 29 English and Welsh leagues and built one head-to-head rating, so we can ask "would A finish ahead of B?" even for two runners who never raced each other, and "who was the best in the country in 2023?".
 Oliver FoxFounder of ontrack · doctor & researcher · runner
22 September 2026 · 9 min read
On the track, the clock settles everything. A 14:02 5,000m is a 14:02 wherever and whenever you run it, so comparing two runners is mostly a matter of reading their times off a list. Cross-country throws that away. Every fixture is a different course, a different distance, a different depth of mud, a different weather — so a winning time of 31 minutes one week and 26 the next tells you nothing about who is fitter. The clock is noise.
What's left is the one thing that does carry across every race: who beat whom. A cross-country result isn't a set of times, it's a finishing order — a full ranking of everyone who showed up. And a ranking is exactly the raw material that rating systems were built for. So we asked a simple question: if you take every finishing position from a decade of British league cross-country and feed it to the same kind of model that rates chess players, can you build one ladder of British distance running — and answer "would A beat B?" for two runners who never lined up together?
The answer is yes, with caveats. Here's the working.
Why cross-country is the pure version of this
There's a nice irony here. In our fastest-tracks post the thing that kept wrecking the analysis was field strength — a fast time at a meet packed with internationals means something different from the same time at a club open, and we had to fight to strip that out. In cross-country, field strength is the whole signal, and it falls out for free.
Think about what a single race tells you. Fifty runners cross the line in order.
That's not one fact, it's 50 × 49 ÷ 2 = 1,225 pairwise facts — A beat B, A beat
C, B beat C, and so on. Beating the winner of a stacked National counts for far
more than winning a small local league, automatically, because the model can see
that the National winner went on to beat people who beat people who beat
everyone in the local league. The strength of who you beat is your rating. No
clock required.
Across our data that adds up to 43.7 million pairwise "A finished ahead of B" outcomes, from 481,073 finishing positions.
The data: a decade of league cross-country
We scraped finishing-order results from 29 English and Welsh cross-country leagues and championships — the Gwent League, the Surrey League, Mid-Lancs, Sussex, the SEAA and Midland and Northern champs, English Schools, and two dozen more — directly from each league's own results pages. Every result is a name, a club, a finishing position and a date.
The headline totals:
- 481,073 results across 856 fixtures in 29 leagues.
- 123,336 distinct athletes once we resolve identity (more on that below — it's the hard part).
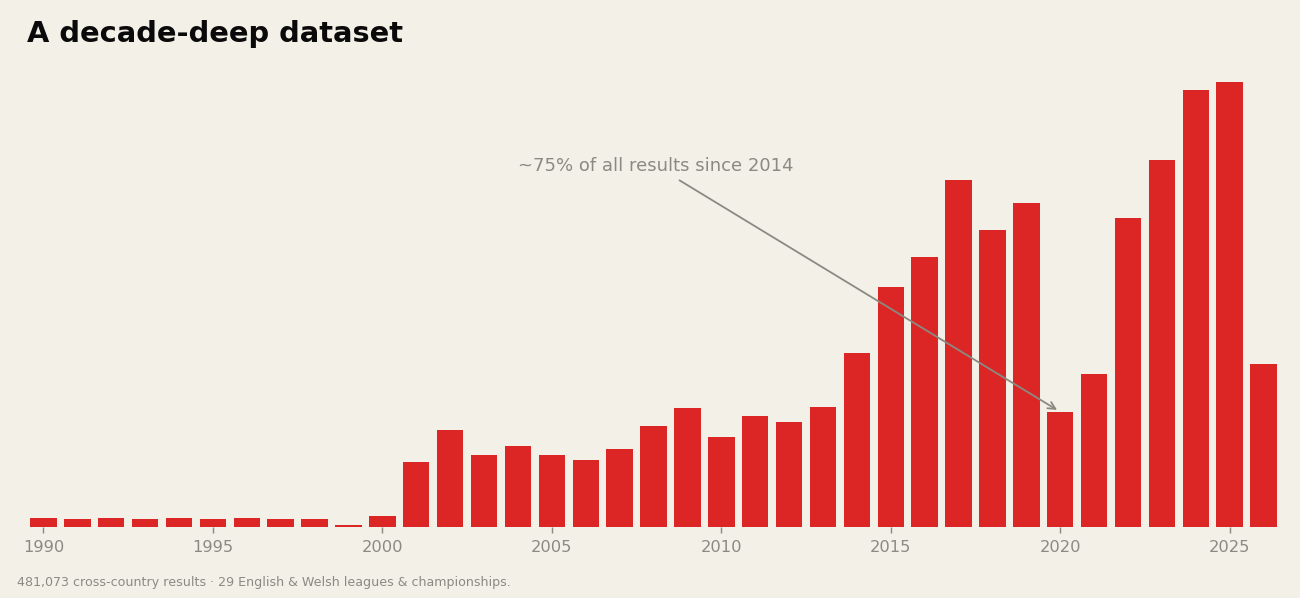
- Real coverage runs ~2014 to 2026, with a thinning tail back to the 1970s. About three-quarters of all results fall in the last decade.
- A 60% men / 40% women split.
It is not a uniform sweep of Britain. Coverage is deep but lumpy — dominant in South Wales (the Gwent League alone is a third of everything), strong across the South-East and the North-West, and thin-and-recent in the Midlands and North-East. That matters for what we can and can't claim, and we'll come back to it.
The method: one rating from a pile of rankings
Each race becomes its pairwise outcomes; pile up every race and you get a giant directed graph of who-beat-whom. We fit a Bradley–Terry model to it — the standard model for exactly this ("given these pairwise results, what single ability per player best explains them?"), the same family that underlies chess Elo. Ability comes out as one number per runner; the gap between two runners' abilities converts directly into a win probability.
Two things we had to get right:
Connectivity. Two runners can only be compared if there's a chain of shared opponents linking them. The good news: league → county → regional → national championships stitch the country together. 71,817 athletes (58%) fall into a single connected component — one comparable network — bridged by the runners who appear in both their local league and the bigger champs.
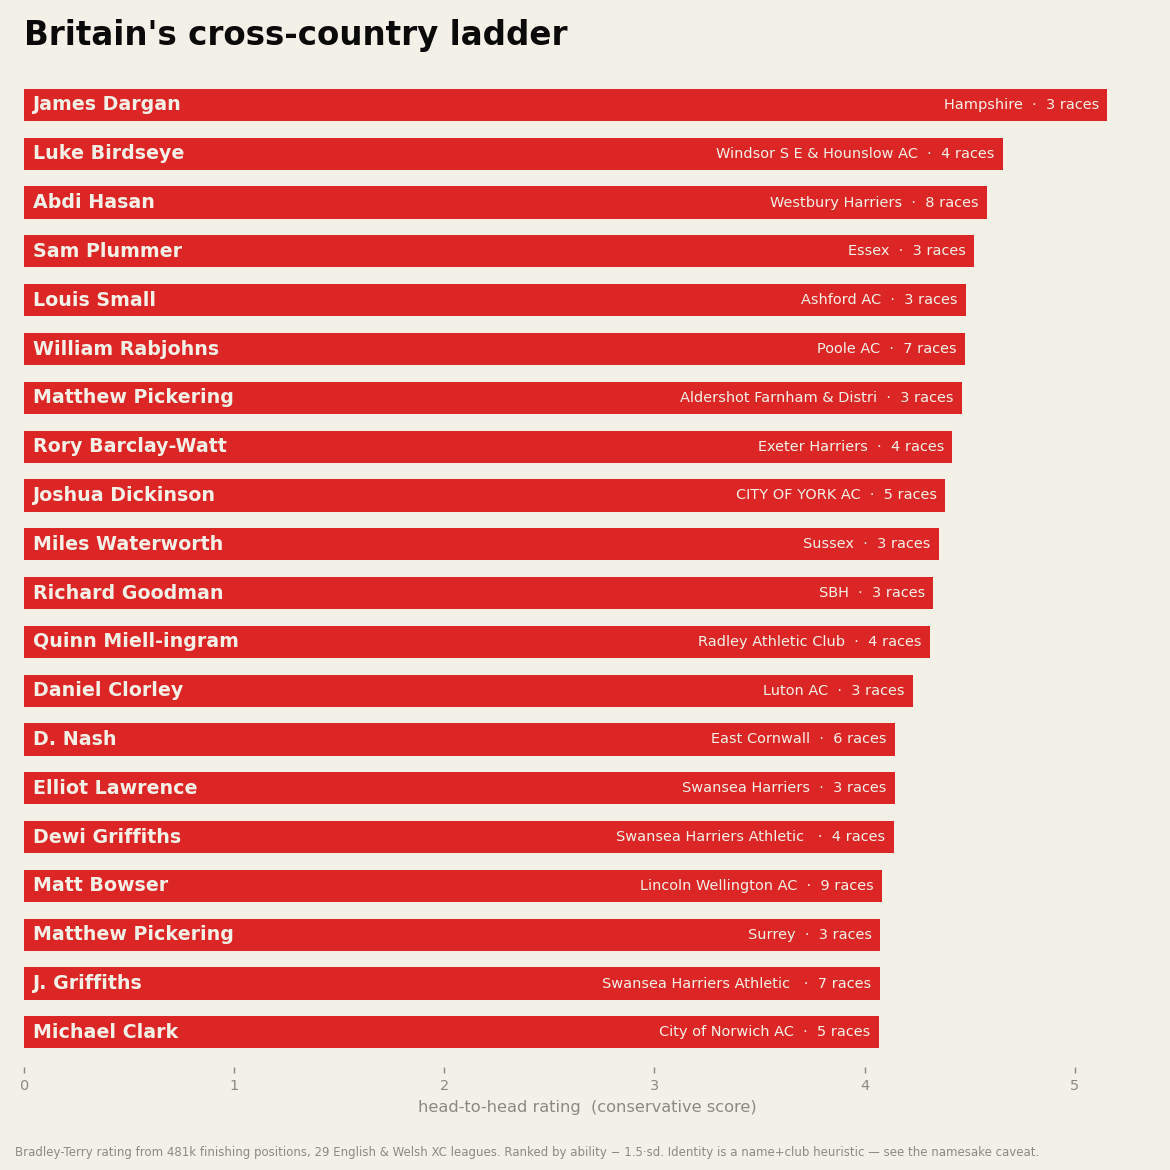
Not letting a three-race winner top the list. A runner who won all three races they entered looks unbeatable to a naive model. So we rank by a conservative score — ability minus 1.5 standard errors — which shrinks small-sample runners until they've earned the rating. A proven nine-race record beats a three-race hot streak.
A first sanity check: the ladder is full of people who should be there — internationals at the top, age-group stars where you'd expect them.
Does it actually work?
"The famous names rise to the top" is reassuring but it isn't proof. The real test is prediction: can the rating call races it has never seen? So we held out a random 20% of all races, fit the model on the other 80%, and asked it to predict who-beat-whom in the held-out races — 3.9 million head-to-heads between runners it had only seen elsewhere.
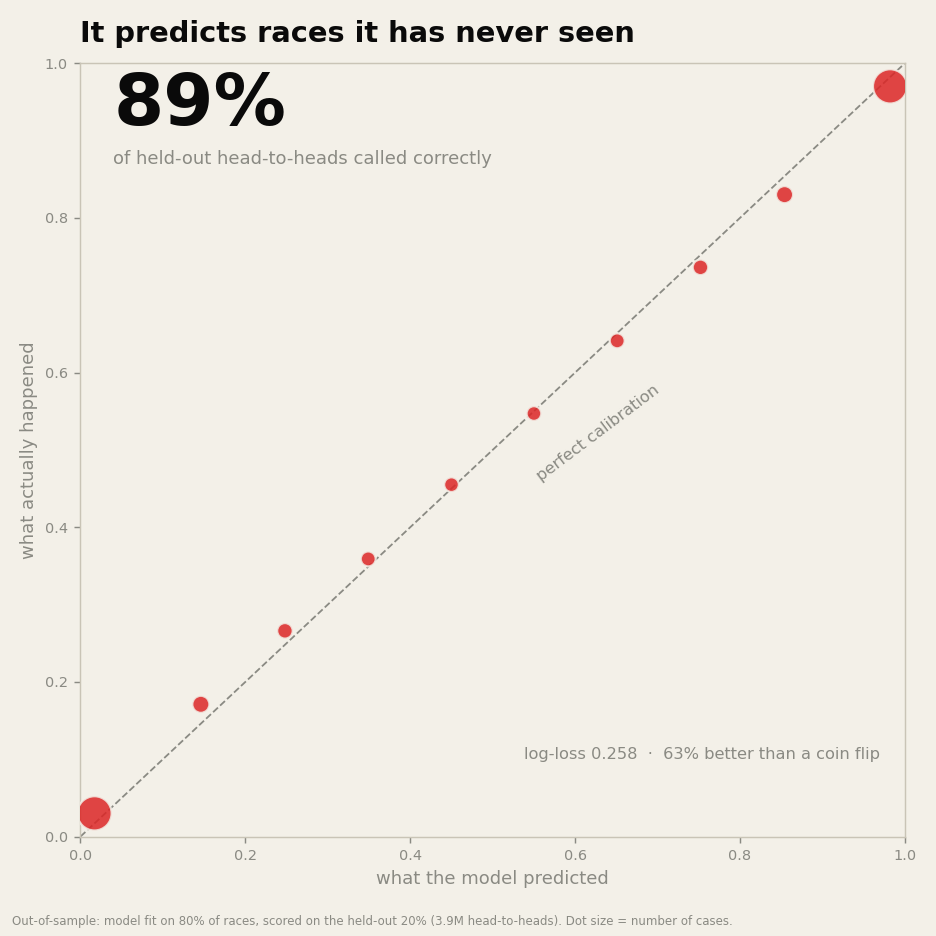
It calls 89% of held-out head-to-heads correctly (a coin flip is 50%), and its probabilities are calibrated: when it says a runner has a 70% chance, it happens about 70% of the time, all the way along the line.
See it on a real race. Below is a race held out of training: the model's predicted finishing order, built only from these runners' other races. Reveal what actually happened — it's mostly right, with the odd upset.
That squares with the other check, on the track: when we run the same position-only method on track races — where we also have the clock as ground truth — the rating it builds from finishing places alone recovers much of the time-based ranking (rank correlation ~0.6–0.7, rising with more races per runner). Positions alone carry most of the signal.
The fun part: "who was the best in 2023?"
A single all-time rating is the wrong question for a sport where people rise, peak and fade. So we also fit the model one season at a time, giving every runner a rating for each year — a career trajectory rather than a fixed number.
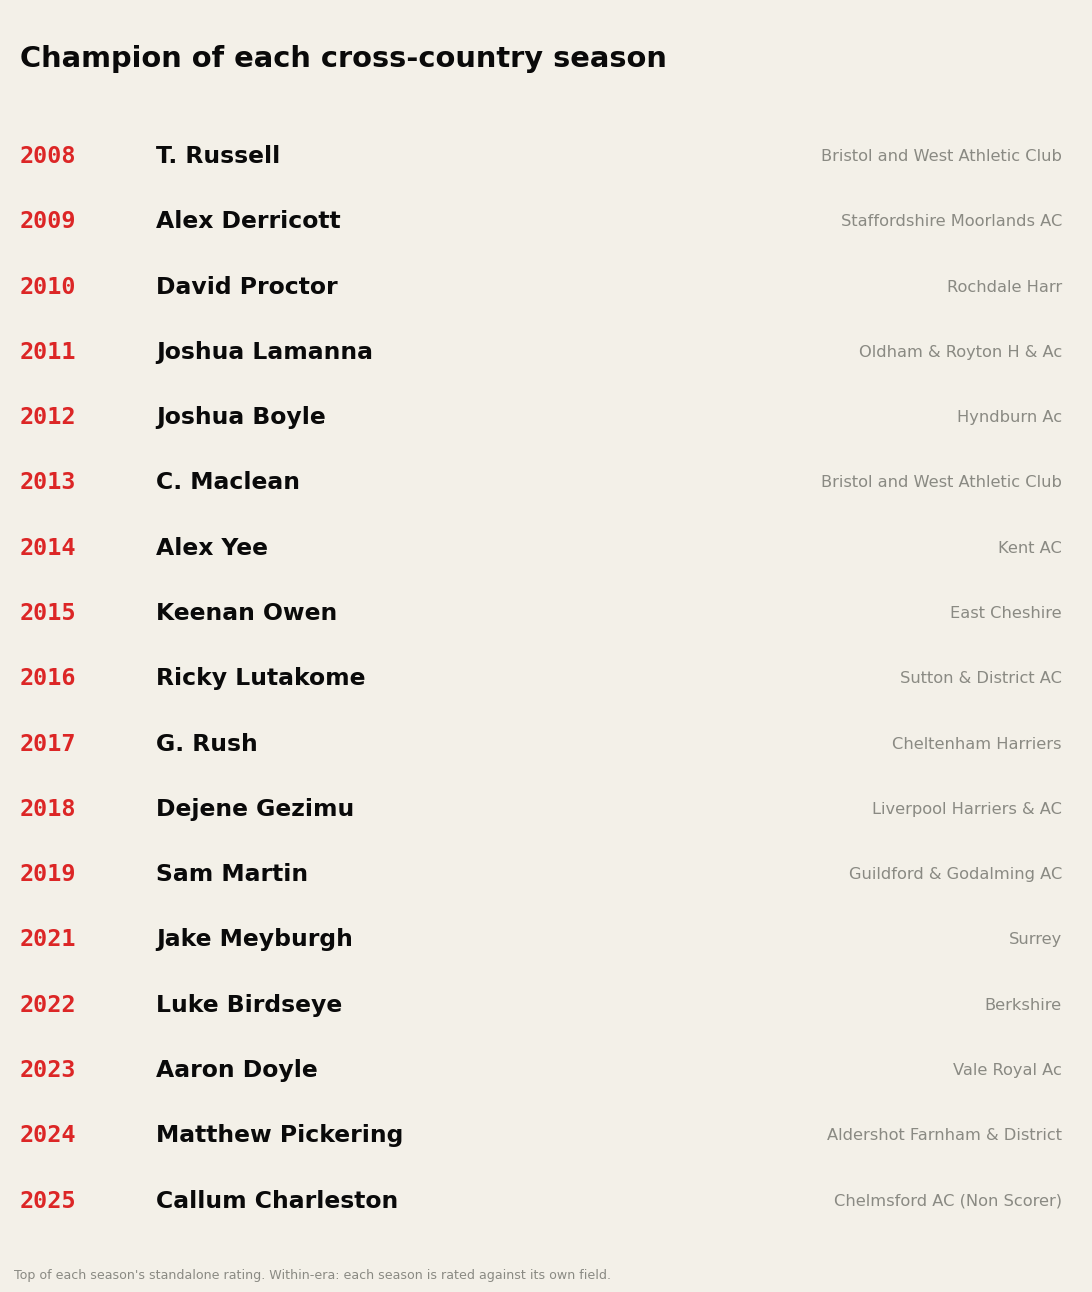
Because each season is rated against its own field, ranking a single season is a clean, well-defined question, and the answers are a roll-call of British distance running as it actually happened:
- 2014: Alex Yee (then Kent AC) tops the country — the year before he became a triathlon megastar.
- 2010–2012: Dewi Griffiths, dominant in the Welsh leagues before his marathon breakthrough.
- 2019: Linton Taylor; 2023: Jack Millar; and so on down the years.
You can pull any season and see who ruled it, and you can plot one runner's trajectory and watch them climb and decline relative to their contemporaries.
"Would 2023 Millar beat 2012 Griffiths?" — and why we won't quite answer it
This is the question everyone actually wants, and it's the one cross-country can't cleanly answer — so we're going to be loud about why.
Each season is rated only against that season's field. To compare 2012 Griffiths with 2023 Millar you have to assume something about how strong the 2012 field was versus 2023, and the only thing linking the two eras is the runners who raced through both — who aged over that span. So "the runner declined" and "the sport got deeper" are mathematically tangled along exactly the links you'd use to compare eras. With no clock anywhere in cross-country, there is no external anchor to separate them.
So we give you two numbers instead of one false one:
- Career-form head-to-head (properly defined, pooled over all years): Griffiths edges it, ~55/45.
- Cross-era, under the stated assumption that the fields were equally strong: ~68% to 2023 Millar — but with a wide interval that brushes a coin-flip, because both sat on thin single-season samples.
The first is the headline. The cross-era number is a bit of fun, not a measurement.
The simulator
For runners within the comparable network, the head-to-head question is clean and we can simulate it. Give the model any set of athletes and it runs the race thousands of times — sampling each runner's ability within its uncertainty — and reports each runner's chance of winning, expected finishing place, and odds of a top-three. It's the same machinery as the ladder, pointed at a hypothetical start line. Build your own below — and because each runner carries their own year, you can line up 2009-you against a runner from any other season and watch a career rise and fade across the start line. Cross-era match-ups lean on the common-scale dynamic ratings above, so treat them as the softer comparison the last section warned about — but they're a lot of fun.
Add runners, then set each one’s year — line up 2009-you against a runner from any other season.
The hard part: who is who?
Everything above rests on one load-bearing assumption: that we can tell who is who. League websites have no athlete ID — just a name and a club typed by a results volunteer — so we have to decide, across 481,000 rows, which ones are the same person. This is where the real work is, and where the caveats live.
We resolve identity on name + club + sex, then fix the three ways that naively breaks:
- Club spelling. "Bristol & West AC", "Bristol and West Athletics" and "Bristol and West AC" are one club; we normalise them together.
- County and national rep teams. A runner shows up under "Surrey" or "Kent" at the inter-county champs and under their actual club everywhere else. We reattach those rep-team results to their real club — but only when it's unambiguous, to avoid guessing.
- One runner, two clubs. Jack Millar races for Bristol & West and for Thames Hare & Hounds, so he was split into two people. We merge a name across clubs into one runner unless those two clubs ever appeared in the same race — which would prove they're two different people. That single rule fixes the genuine dual-club runners while refusing to merge anyone we can prove is distinct.
What we cannot fix without a global athlete ID: two genuinely different people with the same name who simply never raced each other. There are at least two "Matthew Pickering"s in this data, and because they never met, no amount of cleverness separates them for certain — so we stay deliberately conservative and leave ambiguous pile-ups split rather than invent a fake combined runner. We tried to borrow real IDs from the national rankings database to settle these; its anti-scraping protections (rightly) said no, so the namesake caveat stands.
What this is, and isn't
- It's a within-era, position-based rating of league and championship cross-country, strongest from about 2014 on, deepest in South Wales, the South-East and the North-West.
- It rates level on form, not the outcome of one tactical race, and it can't tell fitness from mudlark-strength or hill-craft.
- Cross-era "who'd win on the day" is under-identified and flagged as such.
- Identity is a name-and-club heuristic with a real, quantifiable namesake error — not ground truth.
Where this goes
The natural home for this is inside the app, where it stops being a static ladder and becomes yours: your rating, your rivals, your head-to-heads, the people you keep finishing just behind. The public version stays framed as probabilities with stated uncertainty; the named, personal head-to-heads belong where there's consent. That's the next build.
Cross-country season starts again this month. We'll be watching the network grow.